Fig. 2.
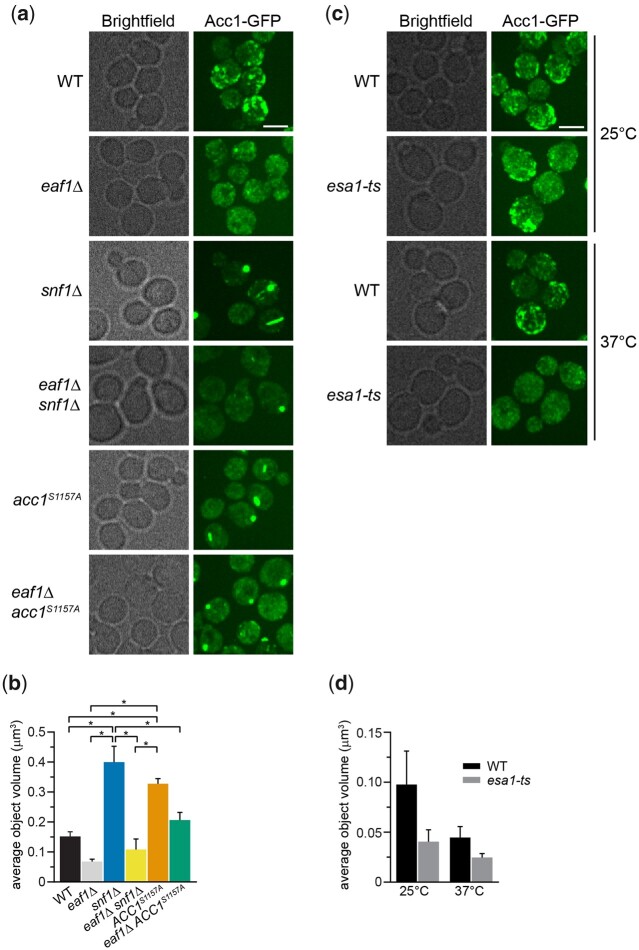
NuA4, Snf1, and Acc1 phosphorylation state mutants impact the localization of Acc1-GFP. a) Wild-type (YKB 3954), eaf1Δ (YKB 4448), snf1Δ (YKB 4348), eaf1Δ snf1Δ (YKB 4364), acc1S1157A (YKB 4401), and eaf1Δ acc1S1157A (YKB 4404) cells expressing endogenously tagged Acc1-GFP were grown to early-log phase at 30°C in YPD and assessed for Acc1-GFP localization. Representative brightfield and fluorescent images are shown. Scale bar: 4 µm. b) The average volume of Acc1-GFP structures in each strain was quantified using IMARIS software. Quantification is the average of 3 biological replicates, a minimum of 100 cells per replicate was scored. Error bars denote the standard error of the mean (SEM). n = 3, *P < 0.05 determined using a 1-way ANOVA test with a Tukey’s multiple comparisons test. c) Wild-type (YKB 3954) and esa1-ts (YKB 4303) yeast expressing endogenously tagged Acc1-GFP were grown to early-log phase at the permissive temperature of 25°C in YPD. Cells were then diluted to an OD600 of 0.2 in YPD and grown at restrictive temperature of 37°C for 2 h before Acc1-GFP localization was assessed. Representative brightfield and fluorescent images at 25°C and 37°C are shown. Scale bar: 4 µm. d) The average volume of Acc1-GFP structures in wt and esa1-ts strains at 25°C and 37°C were quantified using IMARIS software. Quantification is the average of 3 biological replicates, a minimum of 100 cells per replicate was scored. Error bars denote the standard error of the mean (SEM). n = 3, *P < 0.05 determined using a 2-way ANOVA test with a Tukey’s multiple comparisons test.

