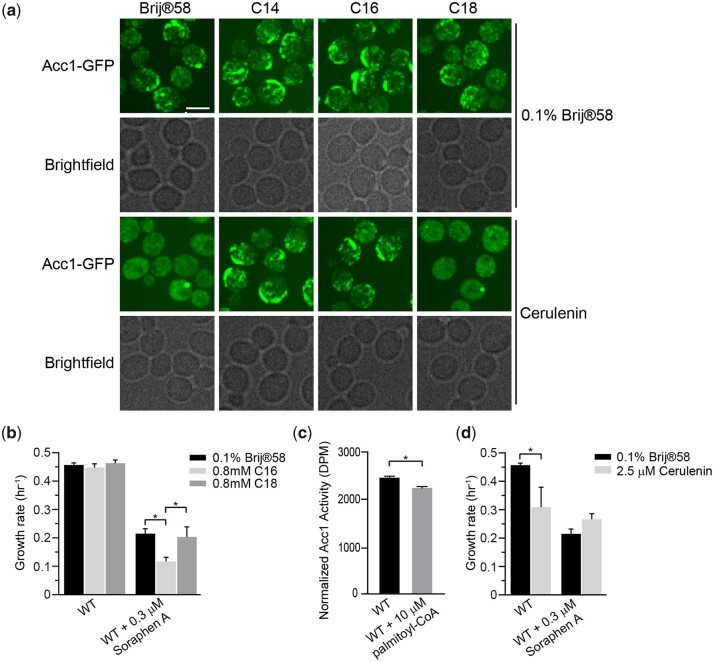
Fig. 5.
Palmitic acid induces the formation of thick rod-like structures of Acc1-GFP and inhibits Acc1 activity. a) Wild-type (YKB 3954) cells expressing endogenously tagged Acc1-GFP were grown to early-log phase before being diluted to an OD600 of 0.1 in YPD containing 0.1% Brij 58 with or without 0.8 mM myristic acid (C14), 0.8 mM palmitic acid (C16), or 0.8 mM stearic acid (C18) and/or 40 µM Cerulenin, grown for 1 h at 30°C and immediately assessed for Acc1-GFP localization. Representative brightfield and fluorescent images are shown. Scale bar: 4 µm. b) Palmitic acid (C16) increases sensitivity of wt cells to Sor A. Wild-type (YKB 1079) cells were grown to early-log phase at 30°C in YPD. Cells were diluted to an OD600 of 0.1 in YPD containing 0.1% Brij 58 with or without 0.3 µM Sor A and/or 0.8 mM palmitic acid (C16) or 0.8 mM stearic acid (C18), automated growth curve analysis at 30°C for 48 h and growth rate was then calculated from 3 biological replicates. Error bars denote the standard error of the mean (SEM). n = 3, *P < 0.05 determined using a 2-way ANOVA test with a Tukey’s multiple comparisons test. c) Wild-type (YKB 3954) cells expressing endogenously tagged Acc1-GFP were grown to early-log phase at 30°C in YPD. Acc1-GFP was then immunoprecipitated and incubated with or without 10 µM Palmitoyl-CoA prior to measure it’s specific activity as described in the Materials and Methods. Acc1-GFP activity was normalized to the relative protein abundance in the sample. Three biological replicates were performed. Error bar indicates the standard error of the mean (SEM). * Denotes statistical significance at a P-value < 0.05 determined using a t-test. d) Cerulenin does not increase sensitivity of wt cells to Sor A. Wild-type (YKB 1079) cells were grown to early-log phase at 30°C in YPD. Cells were diluted to an OD600 of 0.1 in YPD containing DMSO with or without 0.3 µM Sor A and/or 2.5 µM Cerulenin, and an automated growth curve analysis was performed at 30°C for 48 h and the growth rate was then calculated from 3 biological replicates. Error bars denote the standard error of the mean (SEM). n = 3, *P < 0.05 determined using a 2-way ANOVA’s test with a Sidak’s multiple comparisons test.

