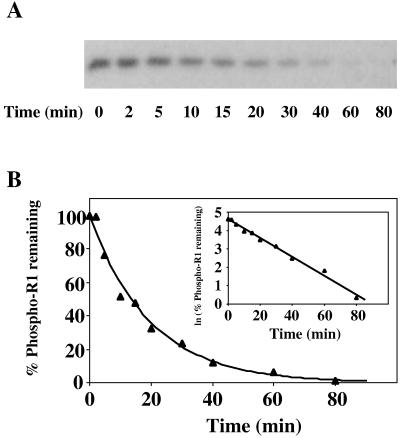
FIG. 6.
Dephosphorylation rate of phospho-SLN1-R1. (A) Autoradiograph showing dephosphorylation of phospho-SLN1-R1 as a function of time. Phospho-YPD1 (0.5 μM) was incubated with a 20-fold molar excess of SLN1-R1 in 50 mM Tris-HCl (pH 7.5)–5 mM MgCl2–1 mM DTT at room temperature for 1 min to allow complete transfer of the phosphoryl group. An aliquot was then removed, mixed with stop buffer, and labeled t0. Subsequently, aliquots were removed at specific time points over the course of 80 min and mixed with stop buffer to terminate the reaction. Proteins were separated on SDS–15% polyacrylamide gels and analyzed as indicated in the legend to Fig. 3. (B) The autoradiographs were further analyzed by scanning laser densitometry to determine the fraction of phospho-SLN1-R1 remaining. Dephosphorylation of phospho-SLN1-R1 followed first-order rate kinetics, and the rate constant and half-life of phospho-SLN1-R1 were determined accordingly. The lines represent computer-generated least-squares fitting to a single exponential or a linear relationship (inset). Data shown are from a representative experiment which was performed multiple times.

