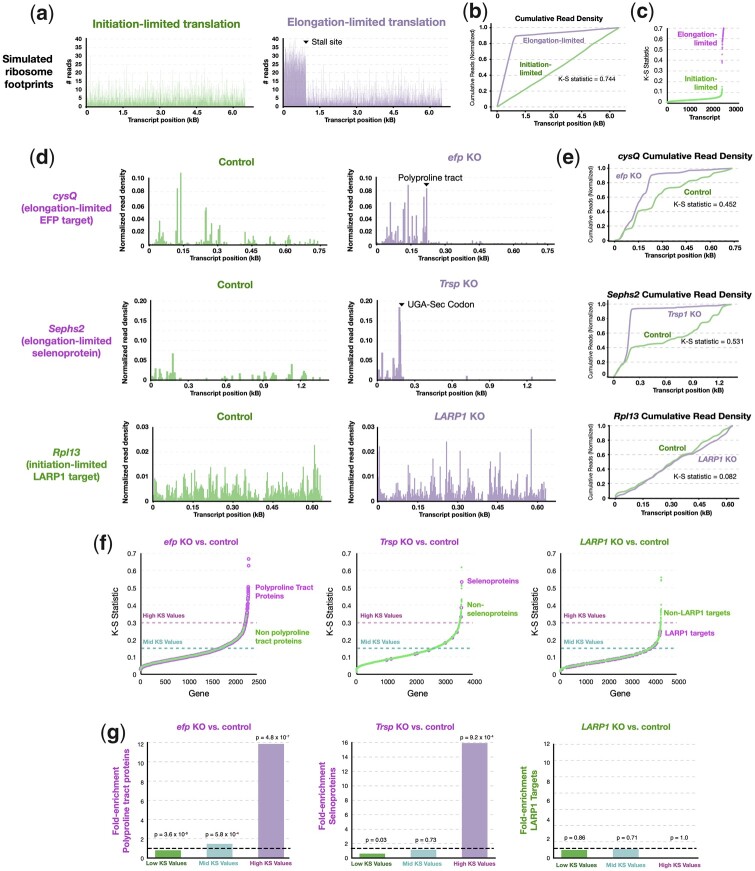
Fig. 3.
Elongation limitation leads to a quantifiable change in the distribution of ribosome footprints. a) Simulated ribosome footprinting profiles of initiation-limited and elongation-limited transcript using the inhomogenous ℓ-TASEP model (Erdmann-Pham et al. 2020). b) Cumulative distribution plots showing a large difference in the distribution of ribosome footprints (high K–S scores) in a simulated elongation-limited vs initiation-limited transcript. c) Plot showing high K–S values derived from comparisons (as in b) between elongation-limited but not initiation-limited transcripts. d) Ribosome footprinting profiles of cysQ and Sephs2 showing reduced ribosome densities (Woolstenhulme et al. 2015; Fradejas-Villar et al. 2017b) following stall sites induced in cells lacking efp and Trsp, respectively, whereas no stall is detected for the LARP1 target (Philippe et al. 2020) Rpl13. e) Cumulative distribution plots of (d) showing large differences in the distribution of ribosome footprints for cysQ and Sephs2 but not Rpl13 in mutant vs control cells. f, g) Plots showing that genes with known stall sites, efp targets and selenoproteins, have high K–S scores >0.3 in cells lacking efp and Trsp, respectively. LARP1 targets, which have altered translation initiation, in LARP1 KO cells do not have K–S scores >0.3.

