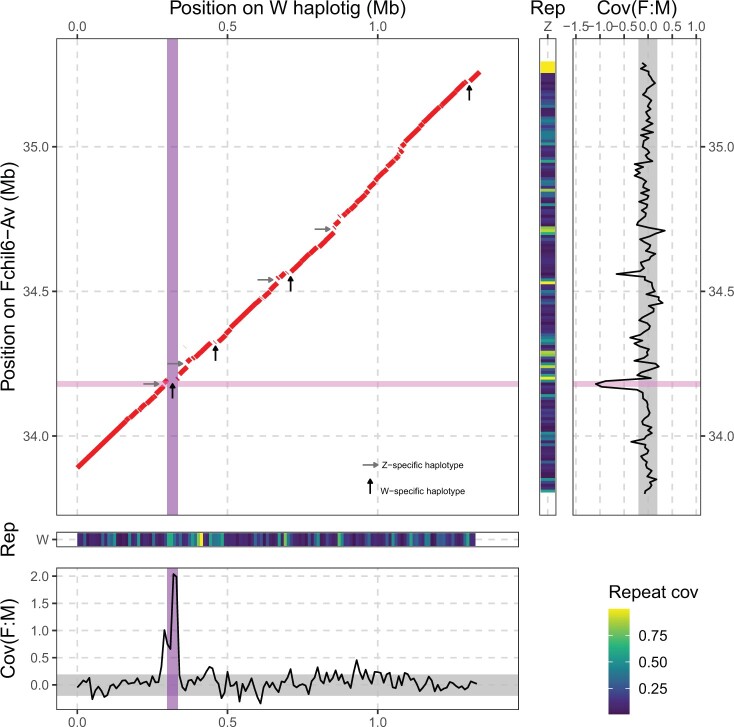
Fig. 4.
Identification and characterization of W- and Z-specific regions. Top-left: Dotplot of a nucmer alignment between the W and Z haplotype-resolved region. Specific regions of the Z-haplotype and W-haplotype sequences are highlighted by horizontal gray and vertical black arrows, respectively. Middle panels: Repeat coverage on the W (bottom) and Z (right) haplotype sequences. Bottom and far right: Coverage difference between males and females [log2(mean F) − log2(mean M)] on nonoverlapping 10-kb windows: on the W haplotig (bottom) and on the Z homologous region (right). The region highlighted in dark purple represents the SDR, in light purple a Z-specific region. Values close to 0 indicate regions shared between Z and W (PAR), −1 and > 0 potential Z- and W-specific regions, respectively.

