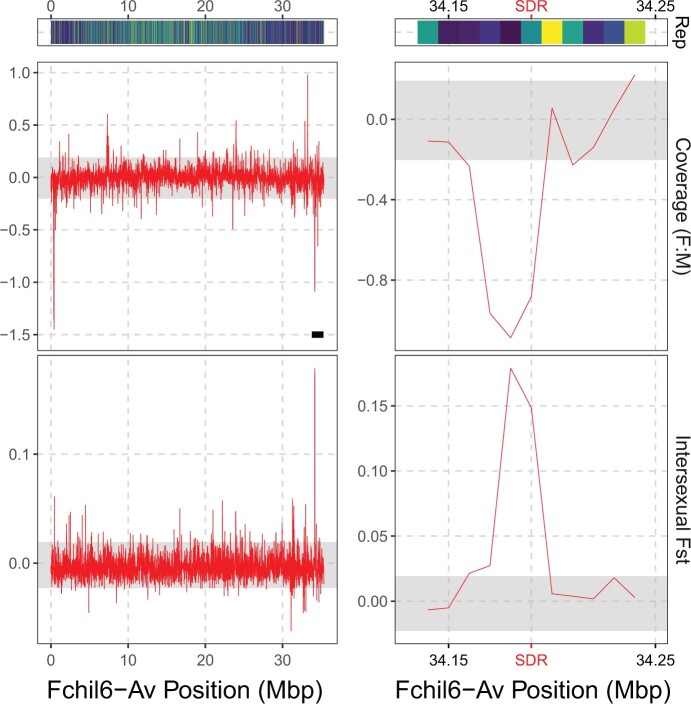
Fig. 5.
Repeat coverage, intersexual weighted FST, and difference between males and females in coverage [log2(mean F) − log2(mean M)] across the sex chromosome (Fchil6-Av) in nonoverlapping 10-kb windows. The gray area represents the 95% confidence interval obtained by resampling a representative autosome (Fchil3-B1) 1,000 times. The black line on the top left panel highlights the haplotype-resolved region illustrated in Fig. 4. For the FST analysis, the reads were remapped on the reference sequence without the inclusion of the W haplotype which was included in the coverage analysis. The right panel represents a zoomed view of the region at the vicinity of the SDR insertion on the Z chromosome, defined by the F-box and arabinogalactan genes.

