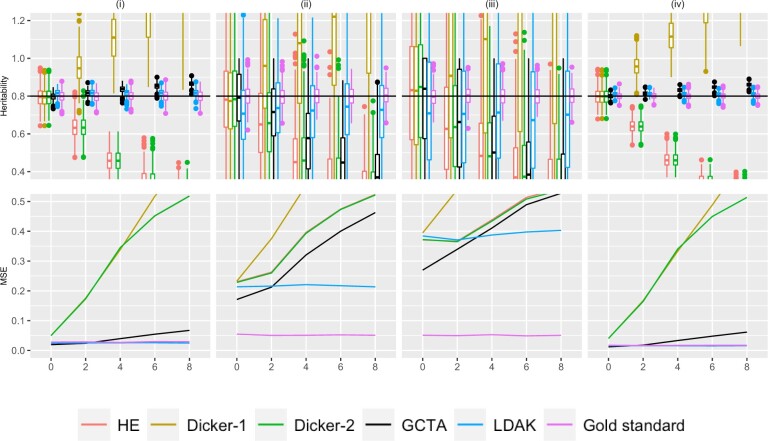
Fig. 3.
Simulation Study 1C (repeated markers). On the top row, the X-axis plots the parameter r, the number of times that 10% of the markers are being repeated as described in Supplementary Section 4. Estimates of h2 using different estimators are plotted along the Y-axis. The value n refers to the number of individuals simulated. The value m is the total number of causal markers simulated, as described in Simulation Strategy. We consider (i) (ii) , (iii) (iv) . Five hundred data sets were simulated for each condition. A horizontal line is shown at , the simulated truth. On the bottom row, the X-axis is the parameter r, and the MSE of each of the estimators is plotted on the Y-axis.

