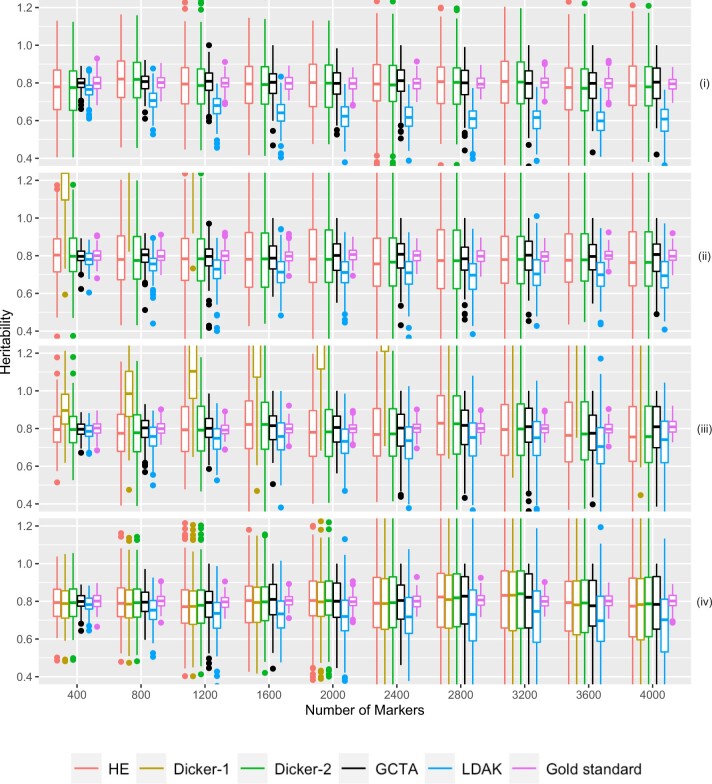
Fig. 5.
Simulation Study 3. Estimated h2 from 500 sets of 10 groups of 40 related cousins plotted on the Y-axis. The number of causal markers plotted on the X-axis. Data were simulated as described in Simulation Study 3: Impact of Relatedness in Individuals. Different estimators are plotted in different colors. True heritability was set to be 0.8. Note that because of the chosen range of y values, Dicker-1 is sometimes not visible in the figure. Panels (i), (ii), (iii), and (iv) are first-, second-, third-cousins, and unrelated individuals, respectively.

