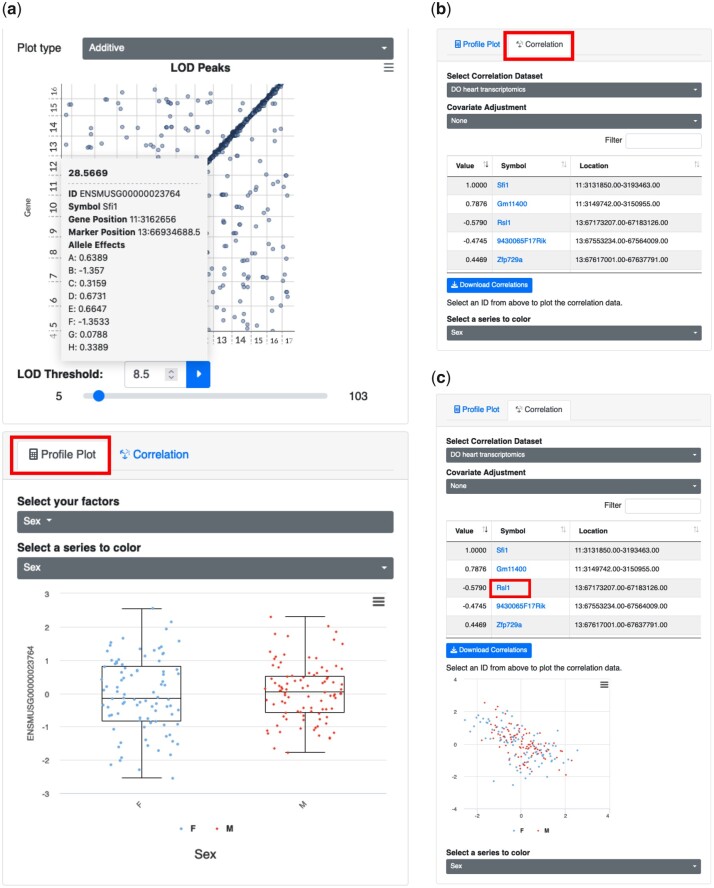
Fig. 5.
Plots for relating traits and covariates. After searching for a specific trait or selecting one based on its QTL, QTLViewer can visualize the trait’s profile according to covariates in the data with “Profile Plot.” After clicking on the point corresponding to the gene Sfi1 on the LOD peaks plots, QTLViewer outputs the normalized expression of the Sfi1 (y-axis) categorized by sex (x-axis) as boxplots (a). Additionally, QTLViewer can display the correlation of a trait of interest with all the other elements of the data using the “Correlation” tab (b). The correlation data can also be downloaded locally by the user. All the elements on the correlation table are clickable. Clicking on “Rsl1” will generate a scatter plot between this gene and Sfi1, which illustrates the negative correlation between these 2 genes (c). Sfi1 is negatively correlated with its mediator Rsl1, suggesting that Rsl1 expression inhibits Sfi1 expression.

