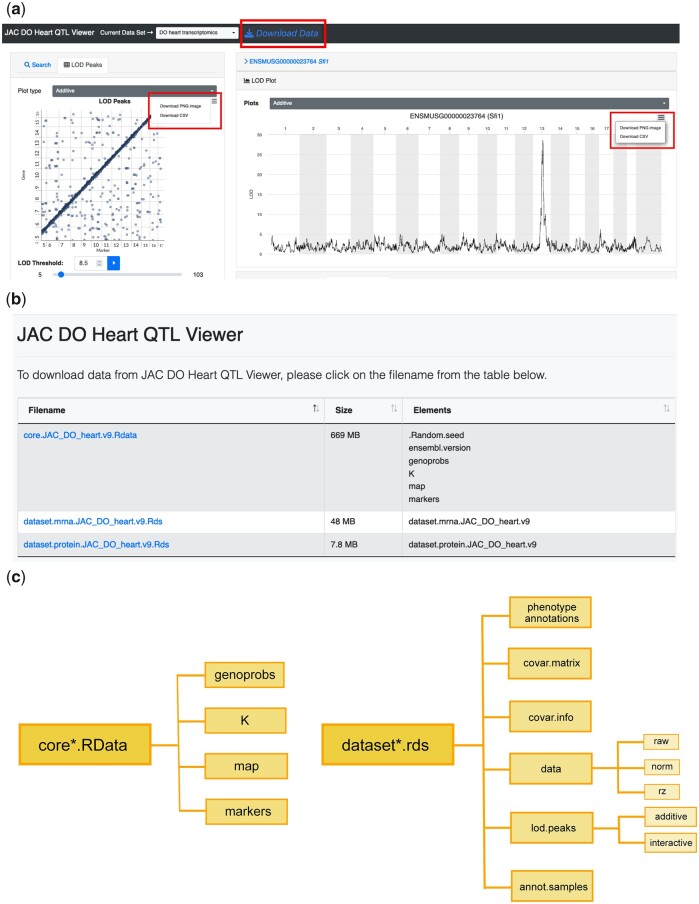
Fig. 6.
Figures and data download from QTLViewer. All plots generated by QTLViewer can be downloaded by clicking on the top right button in the application window (a). In addition to the figures, the processed data used as input to all analyses can be downloaded as R data files by clicking on “Download Data” (a). When using this option, users will be directed to a different webpage listing different components of the data for download (b). This includes a core RData object containing all information necessary for mapping, such as genotype probabilities, kinship matrix, and genomic map, and RDS files containing trait information, such as transcriptome (“dataset.mrna”) and proteome (“dataset.protein”) data. These RDS files are nested lists containing phenotype annotations, a matrix of covariates used for the QTL mapping (“covar.matrix”), information about the covariates (“covar.info”), trait data matrices, QTL mapping results (“lod.peaks”), and sample annotations (“annot.samples”) (c). With gene expression data, “dataset.mrna” is a list with different forms of data as matrices, including the raw counts (raw) the normalized data (norm), and inverse normal transformed data (rz) (c). The QTL mapping results “lod.peaks” is a list with QTL result tables from standard additive scans and potentially factor-interactive QTL scans (c).

