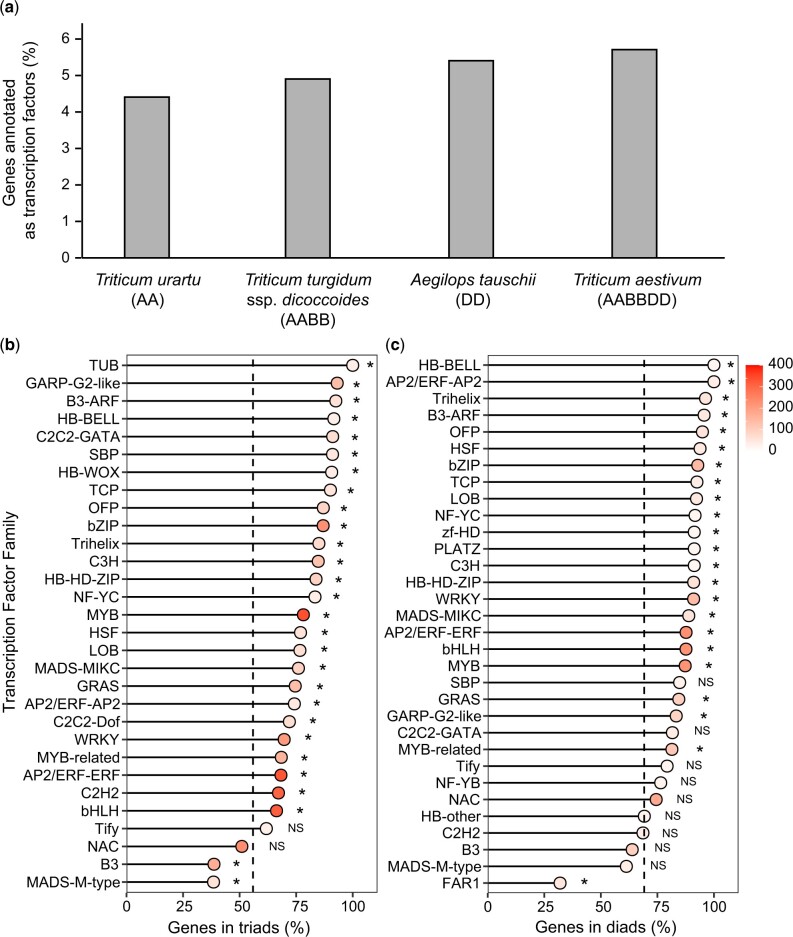
Fig. 1.
TF genes in T. aestivum and ancestral species. a) Percentage of genes annotated as TFs in hexaploid T. aestivum and the tetraploid and diploid ancestral species. b) Percentage of genes in triads in T. aestivum TF families with >10 triads and c) percentage of genes in diads in T. turgidum ssp. dicoccoides TF families with >10 diads. In (b) and (c), the dotted black line indicates the mean value for non-TFs and asterisks (*) denote families which are significantly different from non-TFs (Fisher’s exact test, P < 0.05, FDR corrected for multiple testing). NS, nonsignificant. The fill saturation inside the dots indicates the number of genes in the TF family.

