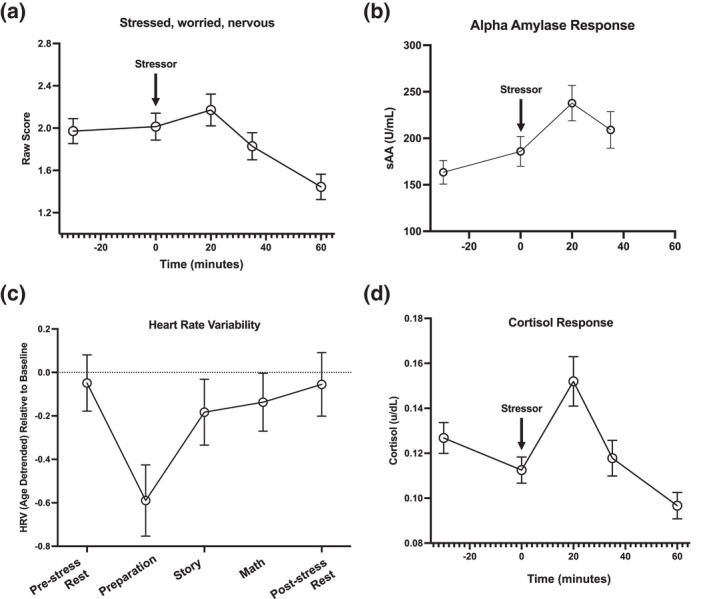
FIGURE 2.

Mean and standard errors for affect ratings, salivary alpha amylase (sAA), heart rate variability (HRV), and salivary cortisol across the stressor session. Stressor (TSST) onset at time = 0. (a) Indicates on average how”stressed, worried, or nervous” individuals felt. (b) Average sAA (measuring SNS response) across the experiment. Note that saliva was not analyzed at the 60‐min timepoint. (c) Average HRV change from baseline (indexing PNS response) across the TSST periods. The x‐axis indicates the recording period starting with pre‐stress rest. (d) Average cortisol response across stress
