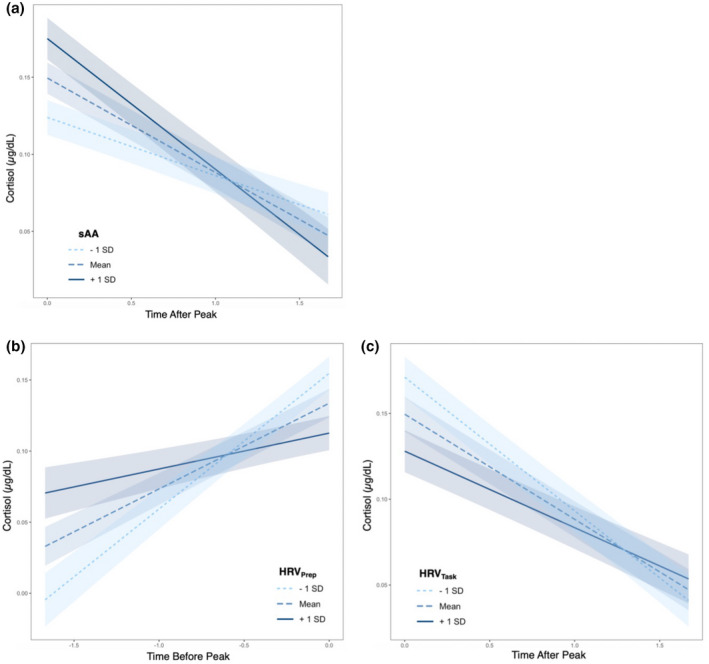
FIGURE 3.

Plots (a–c) show the bivariate relationship between autonomic indices and cortisol response trajectories. X axes are cortisol concentration plotted against time either before (time before peak) or after (time after peak) the knot point in the piecewise growth curve model. Thus, the lines represent cortisol reactivity or cortisol recovery (x = time, y = cortisol, slope = reactivity or recovery) respectively. Shading around lines represent 90% confidence interval of the slope of the line. (a) Line colors depict mean sAA ± 1 standard deviation (SD) used only for visualization purposes (continuous variable in model). Individuals with higher sAA had steeper cortisol recovery slopes. (b) Line colors depict mean HRV during the preparatory period ±1 SD used only for visualization purposes. Individuals with lower preparatory HRV had a sharper increase in their cortisol reactivity slope. (c) Line colors depict mean HRV during the TSST tasks (story and math) ± 1 SD used only for visualization purposes. Participants with lower HRV had a steeper recovery slope
