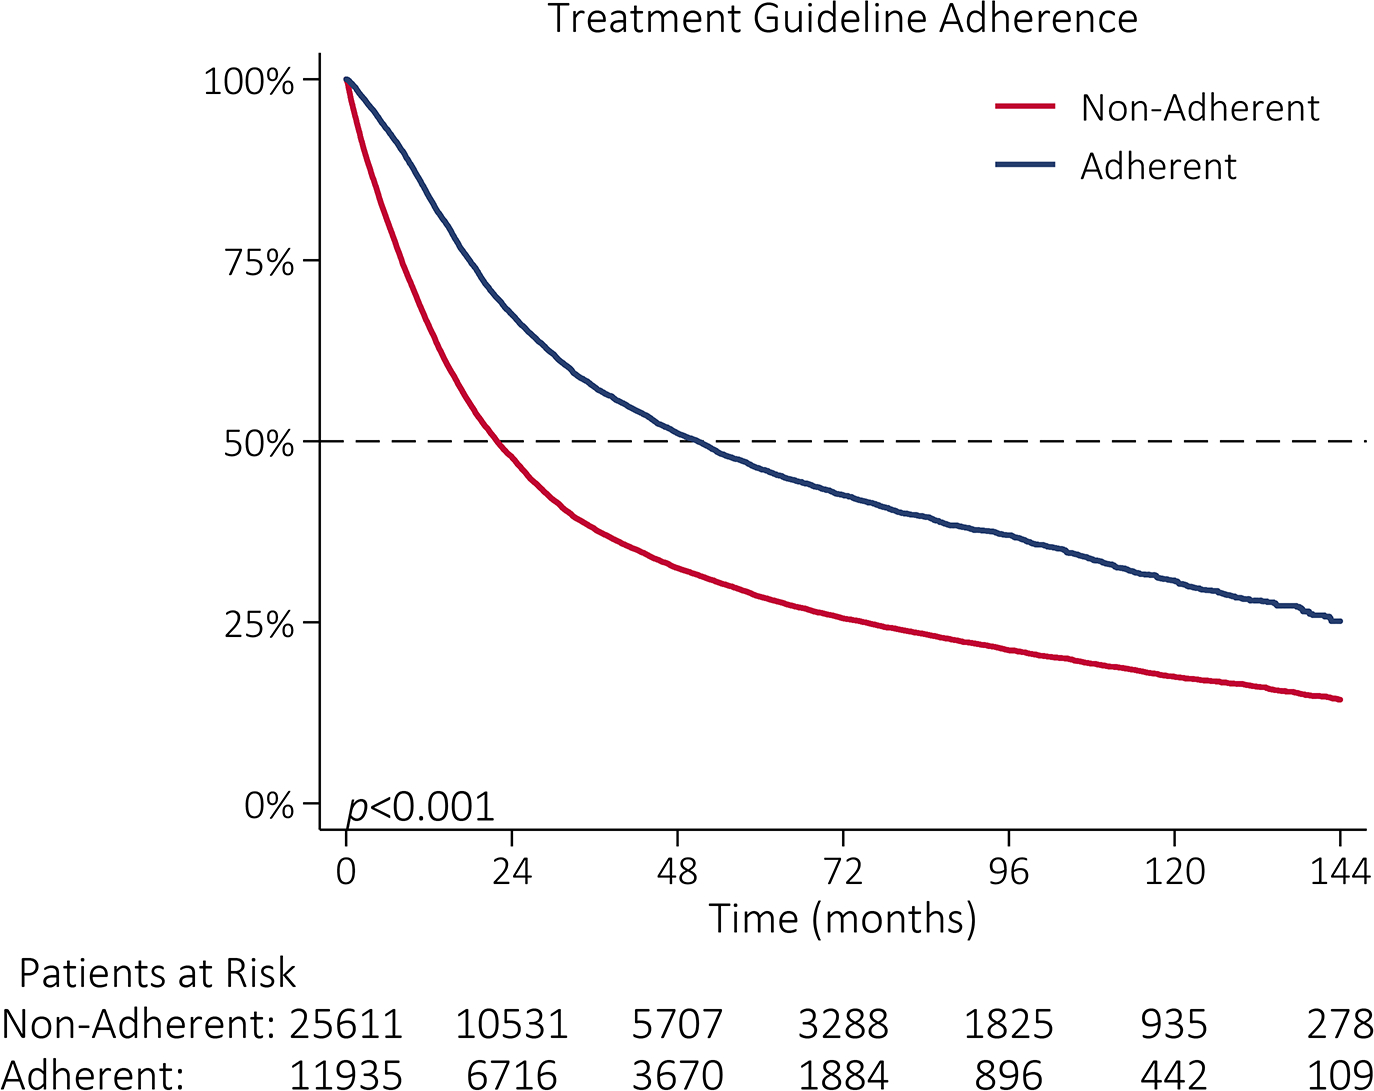
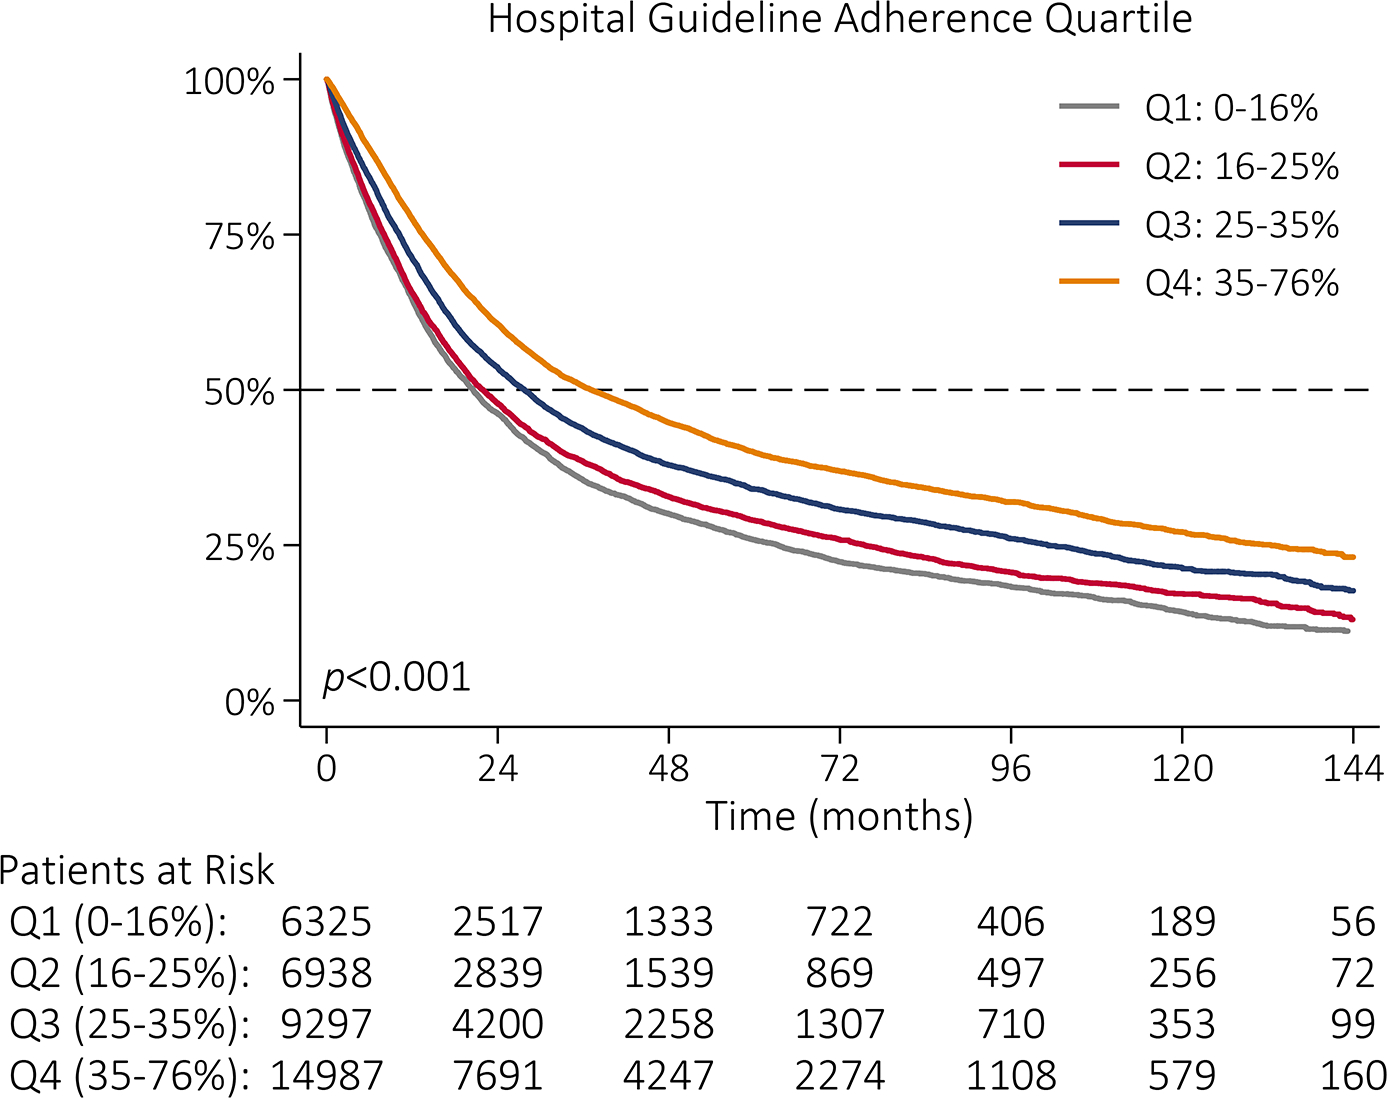
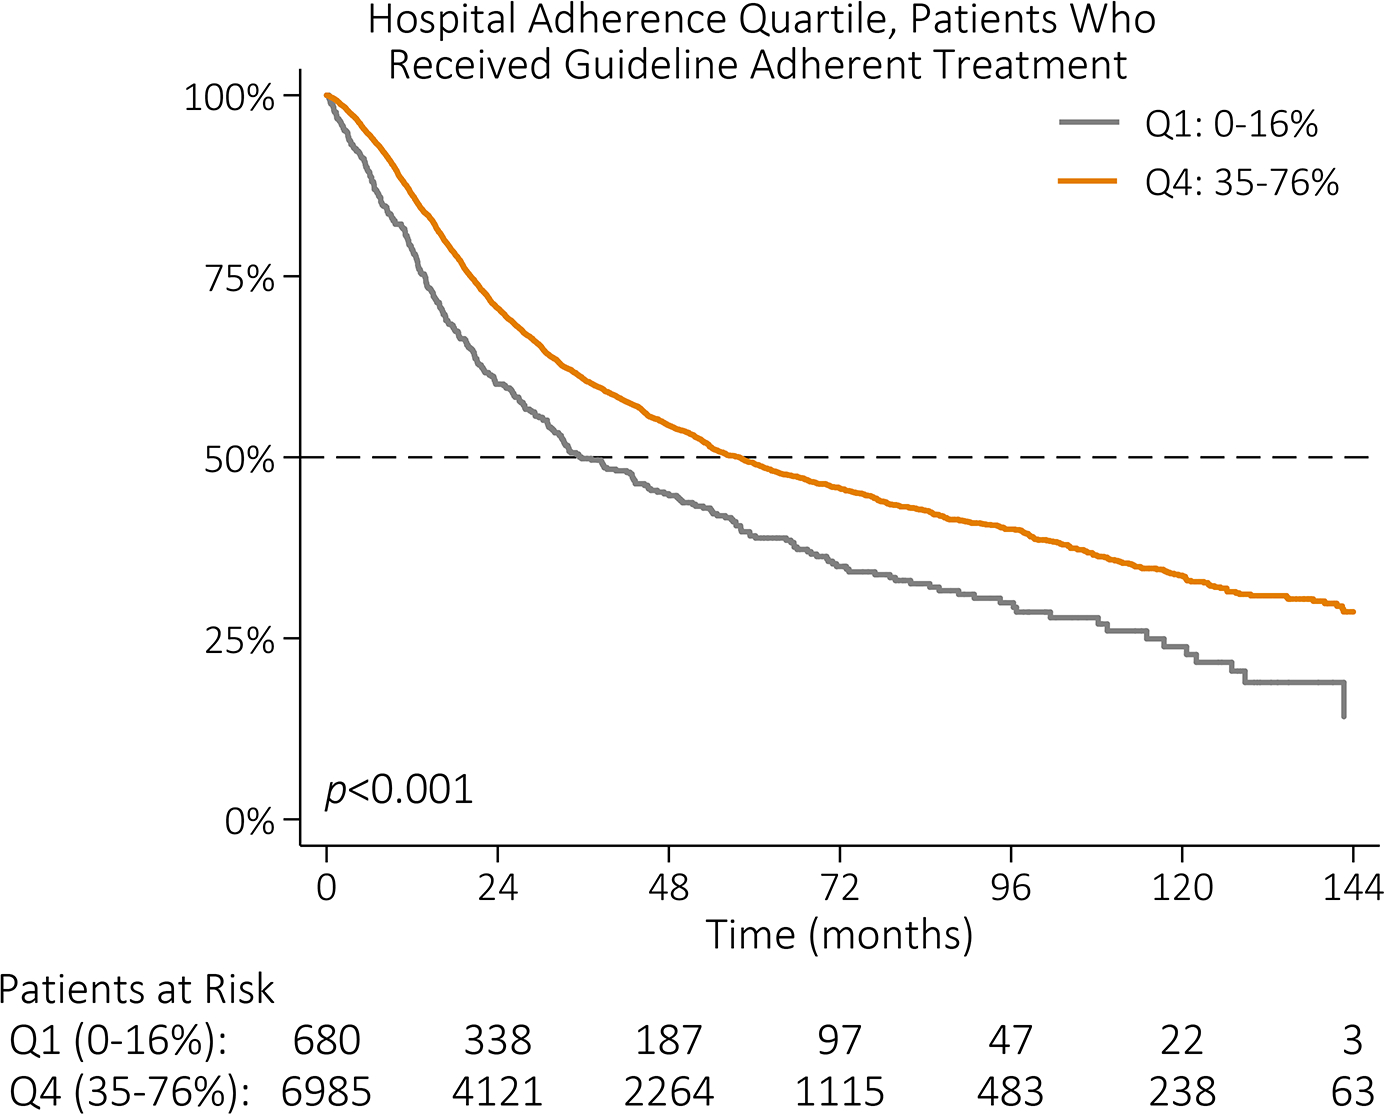
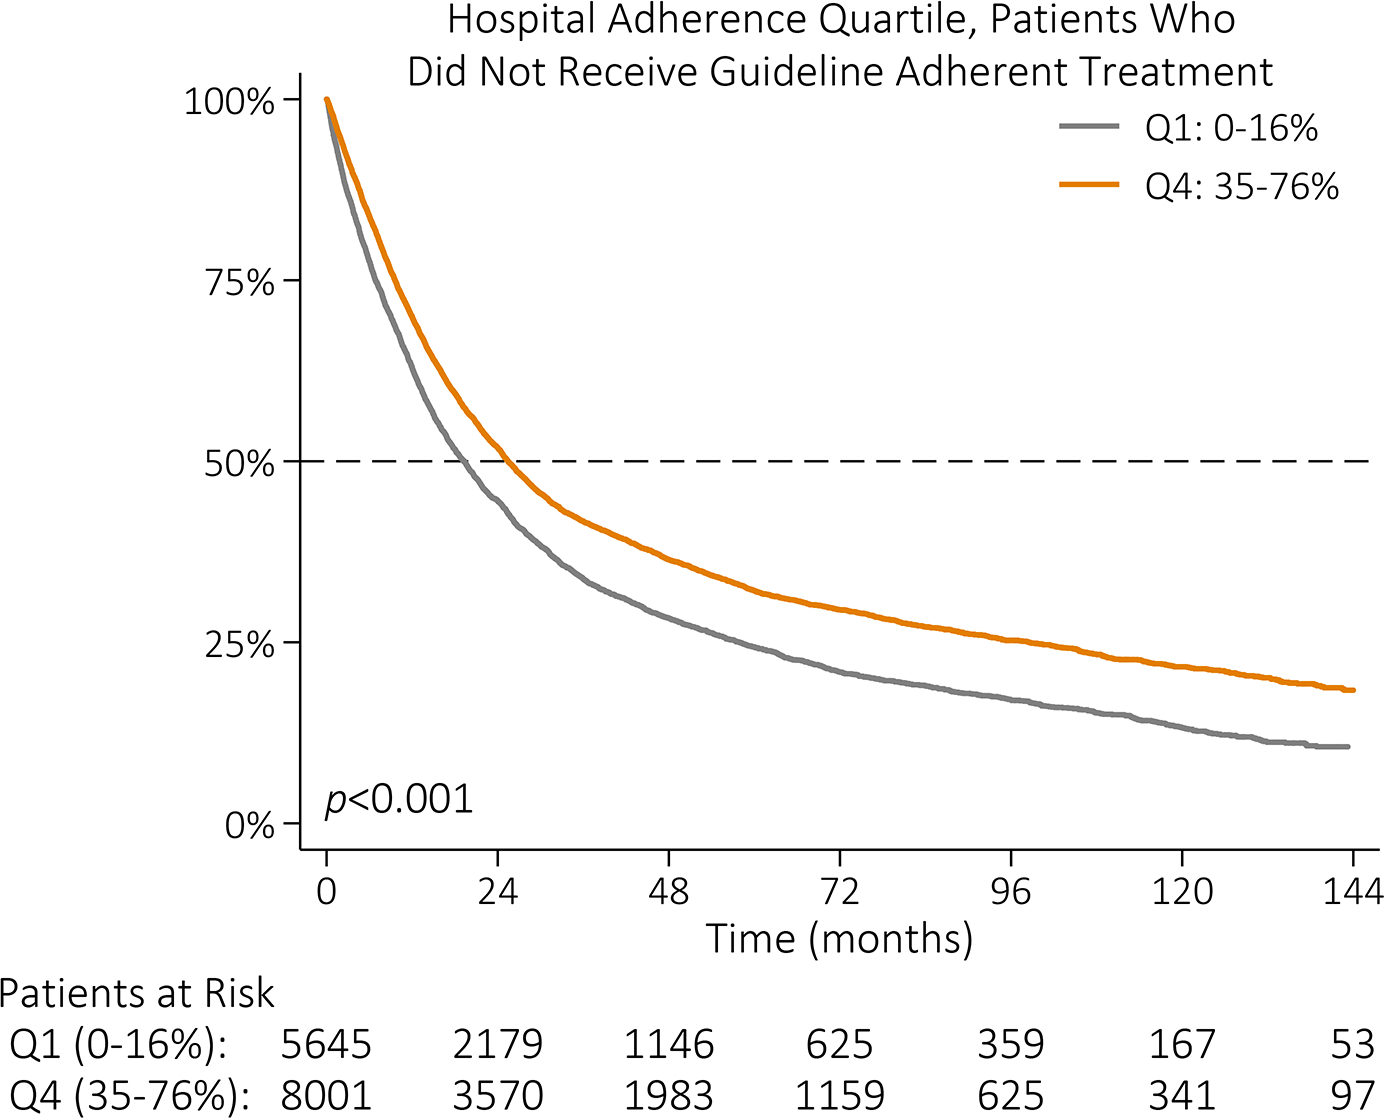
Figure III |.


Kaplan-Meier survival function by (A) NCCN guideline adherence with guideline-adherent primary treatment in blue and non-adherent primary treatment in red; (B) hospital guideline adherence quartile with lowest adherence quartile (Q1: 0–16%) in gray, quartile 2 (Q2: 16–25%) in red, quartile 3 (Q3: 25–35%) in blue, and highest adherence quartile (Q4: 35–76%) in orange; (C) hospital guideline adherence quartile with Q1 in gray and Q4 in orange among patients who received guideline-adherent treatment; and (D) hospital guideline adherence quartile with Q1 in gray and Q4 in orange among patients who did not receive guideline-adherent treatment.
