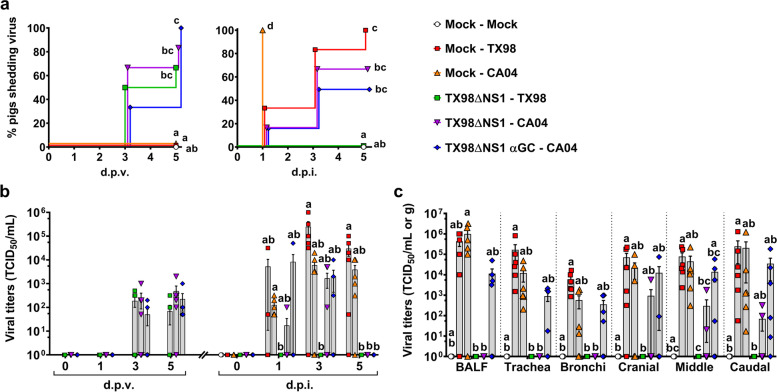
Fig 5.
Viral titers in nasal swabs and respiratory tissues. a Percentage of pigs positive for virus shedding in nasal swabs collected at 0, 1, 3, and 5 d.p.v. and 0, 1, 3, and 5 d.p.i.. b Virus titers in nasal swabs after vaccination and infection. c Virus titers in BALF and homogenized respiratory tissues at 5 d.p.i.. Data are represented as TCID50/mL for nasal swabs and BALF and TCID50/g for respiratory tissues. Differences between treatments were analyzed by Mantel-Cox log-rank test (a), or Dunn’s multiple comparisons test (b, c). A statistically significant difference between two groups is indicated by different letters. Data are represented as mean ± SEM. Symbols represent treatment groups (a) or individual pigs (b, c)

