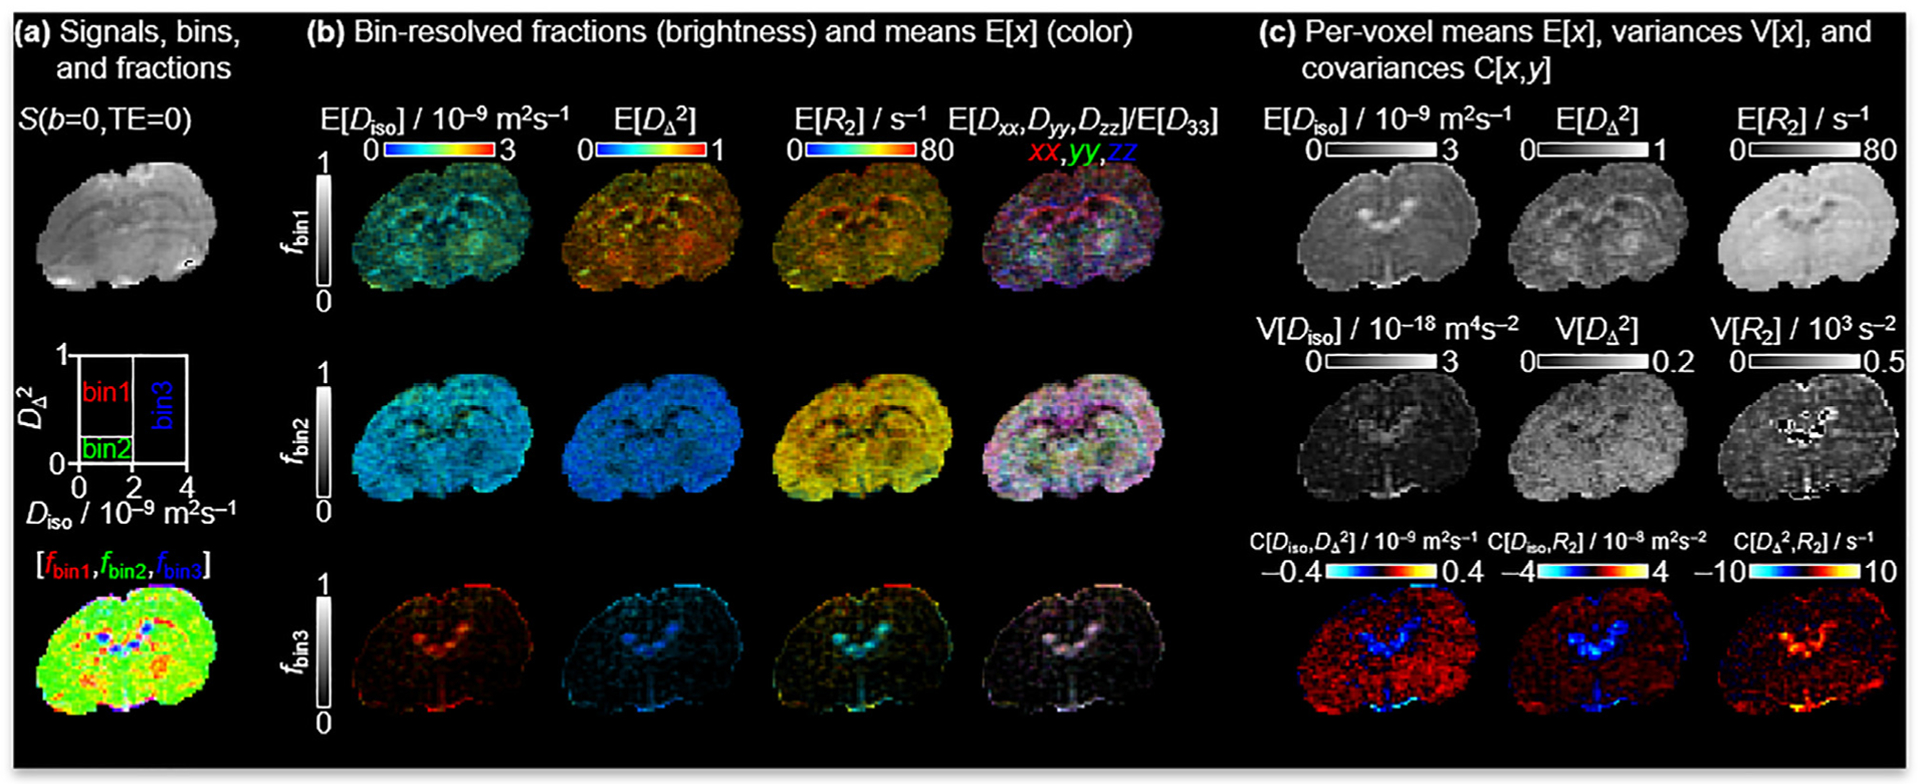
Fig. 3.

Quantitative parameter maps derived from the per-voxel 5D D-R2 distributions. (a) S0 image obtained by Eq. (5). Image segmentation is performed by dividing the 2D plane into three “bins” and calculating signal fractions [fbin1,fbin2,fbin3] mainly reporting on the spatial distributions of WM, GM and CSF. Here, blue refers to CSF, red to WM and green to GM. (b) Bin-resolved signal fractions and means E[x] over the Diso, , and R2 dimensions according to Eq. (8). The bin fractions and means are coded into brightness intensity, and the properties of interest are represented by the color scales, which are each combined by two orthogonal scales in the image. Direction-encoded colors derive from the lab-frame diagonal values [Dxx,Dyy,Dzz] and maximum eigenvalue D33. (c) Per-voxel means E[x], variances V[x] and covariances C[x,y] of various combinations of Diso, , and R2 are as defined in Eqs. (8–10).
