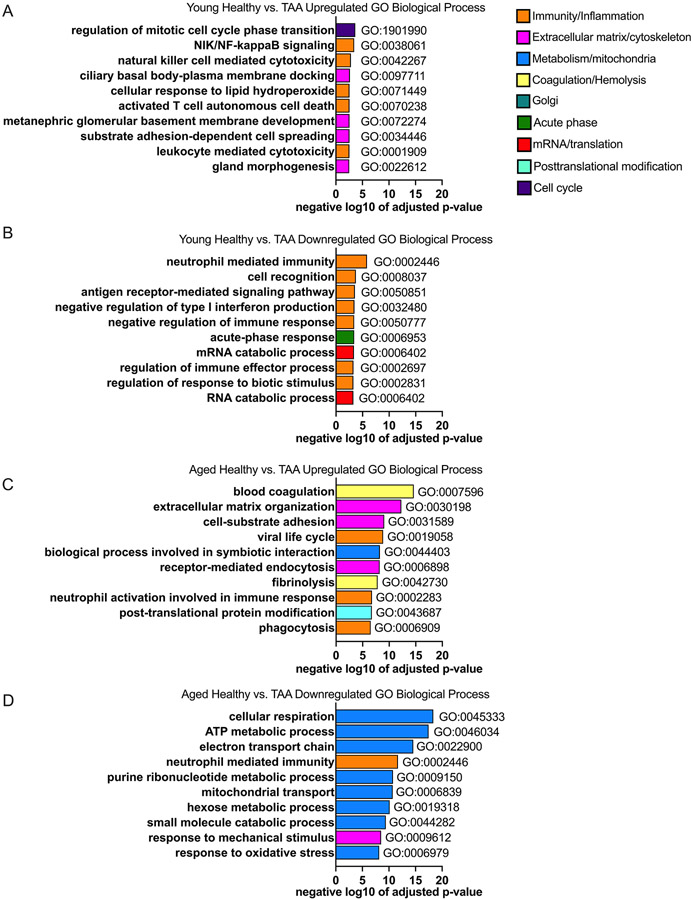
Figure 2: Biologically different processes and networks are impacted by TAA in young as compared to older cohort.
Aortic samples were assessed via mass spectrometry. Young (i.e., <60 years of age) and old (i.e., >60 years of age) in the healthy and TAA groups were compared. N = 4 biological specimens for each group. A and B: Top 10 gene ontology (GO) biological processes from proteins that were significantly up- (A) and down- (B) regulated comparing healthy aortic samples to samples from TAA in the young group and sorted by adjusted p-value. C and D: Top 10 gene ontology (GO) biological processes from proteins that were significantly up- (C) and down- (D) regulated comparing healthy aortic samples to samples from TAA in the aged group and sorted by adjusted p-value. GO biological processes within similar categories were color coded the same. Blue encodes metabolic and mitochondrial processes, orange encodes immune and inflammatory processes, yellow encodes hemolysis and coagulation processes, pink encodes cytoskeletal and extracellular matrix processes, cyan encodes posttranslational modifications, teal encodes golgi-related processes, green encodes acute phase proteins, red encodes mRNA processes, and purple encodes cell cycle processes.

