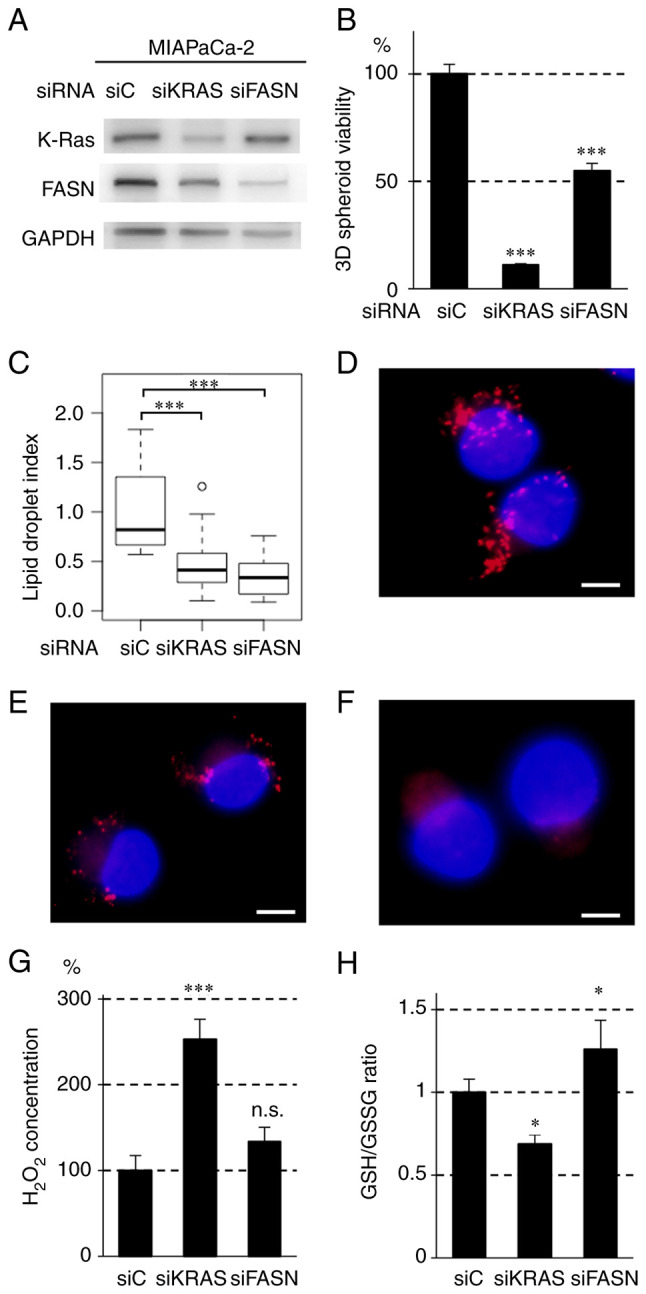
Figure 5.

Effect of siRNA against KRAS (siKRAS) and FASN (siFASN) on (B) 3D-spheroid formation, (C-F) lipogenesis and (G and H) redox regulation in MIAPaCa-2 cells. (A) Immunoblot analysis of MIAPaCa-2 cells treated with control (siC), siKRAS and siFASN. A total of 1×10⁵ cells were treated with the siRNAs for 24 h, followed by nonadherent culture for 48 h. GAPDH was used as the internal control. (B) 3D-spheroid viability of cell lines treated with siC, siKRAS and siFASN. A total of 1×10⁵ cells were treated with siRNA for 24 h, followed by spheroid culture in a 96-well V-bottom plate for 72 h in triplicate. 3D-spheroid viability was determined by measuring adenosine triphosphate (ATP) content using the CellTiter-Glo® 3D assay. Error bars represent standard deviation. ***P<0.001 vs. siC using Tukey's test. (C) Box plot of the areas of lipid droplets in MIAPaCa-2 cells treated with siC, siKRAS and siFASN. The cells were seeded into culture dishes at a density of 1.0×10⁵ cells/dish. When the cell density reached ~60%, siKRAS and siFASN were added and incubated for 72 h. The cells were fixed in 4% paraformaldehyde and stained with LipiDyeII and DAPI. The integrated density of LipiDyeII staining (n=20 for each group) was measured using ImageJ software and normalized to the average of the control (siC) group. In the plots, the box indicates the lower and upper quartiles, the horizontal bar represents the median, the whiskers are the highest and lowest data points that fall within 1.5 times the interquartile range from the lower and upper quartiles and the dots are the outliers. ***P<0.001 compared with siC using Tukey's test. Representative images of lipid droplet formation treated with (D) siC, (E) siKRAS and (F) siFASN for 72 h in MIAPaCa-2 cells. The nuclei of the cells were stained with DAPI (blue) and the lipid droplets were stained with LipiDyeII (red). Scale bars=10 µm. (G) H2O2 content in MIAPaCa-2 cells treated with siC, siKRAS and siFASN. A total of 1×10⁵ cells were treated with siKRAS and siFASN for 24 h, followed by nonadherent culture for 48 h. H2O2 concentration in the culture medium was determined using the Amplite fluorimetric H2O2 kit and normalized to cellular protein content. The bars indicate the mean ± standard deviation. ***P<0.001 compared with siC using Tukey's test. n.s., not significant. (H) GSH/GSSG in MIAPaCa-2 cells treated with siC, siKRAS and siFASN. A total of 1×10⁵ cells were treated with siKRAS and siFASN for 24 h, followed by nonadherent culture for 48 h. GSH/GSSG was determined by measuring GSH and GSSG using the GSH/GSSG-Glo Assay kit. The bars indicate mean ± standard deviation. *P<0.05 compared with siC using Tukey's test. si, short interfering; KRAS, Kirsten rat sarcoma viral oncogene homolog; FASN, fatty acid synthase; GSH, glutathione-SH; GSSG, glutathione disulfide.
