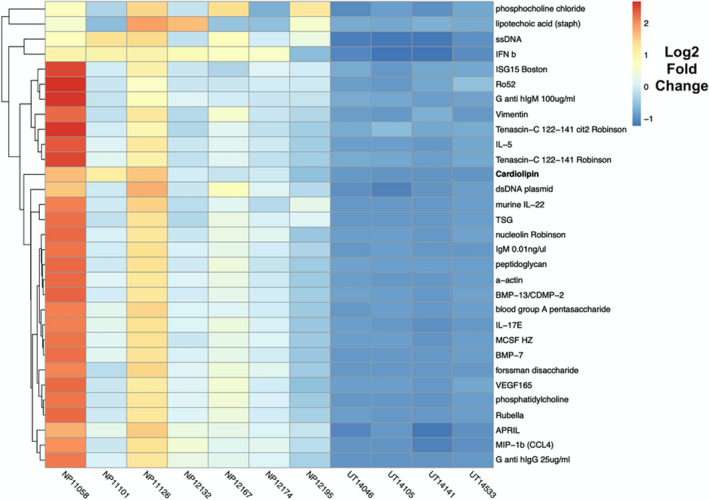
FIGURE 1.

Autoantibody Heatmap. Significance analysis of microarrays (SAM) was used to identify significantly different IgG reactivity to autoantigens between NP tissue (n = 7) and control uncinated tissue (n = ). Significant genes were calculated with samr package with R 3.0.1 with 1000 permutations, q‐value <0.001, fold change >2. The resulting hierarchically clustered heatmap of significant antigens is presented here. Heatmap intensities represented by Log(2) fold change
