FIGURE 5.

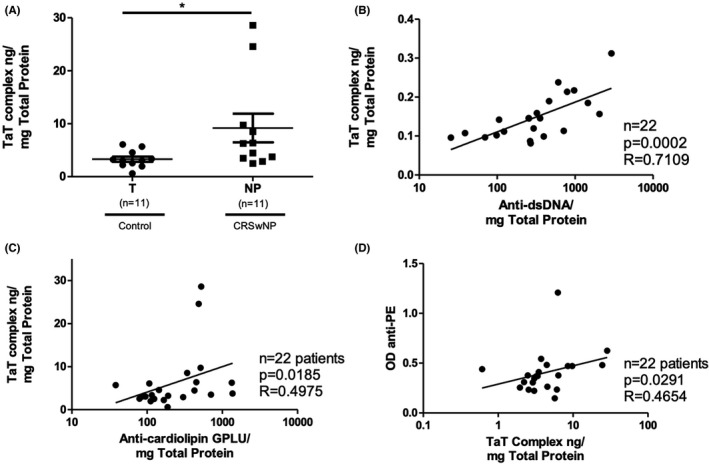
TaT Complex in NP. (A) Comparison of Thrombin‐anti‐Thrombin (TaT) complex levels (a marker of increasing coagulation) between control turbinate (T) and NP tissue (* p < .05) (B) TaT complexes were strongly correlated with anti‐dsDNA IgG. (C) Anti‐cardiolipin IgG levels were also moderately correlated with TaT complex. (D) TaT complex levels were moderately correlated with anti‐PE IgG
