
Figure 2. TOLLIP SNP rs5743854 allele G is associated with decreased LPS-induced cytokine responses in peripheral blood DC.
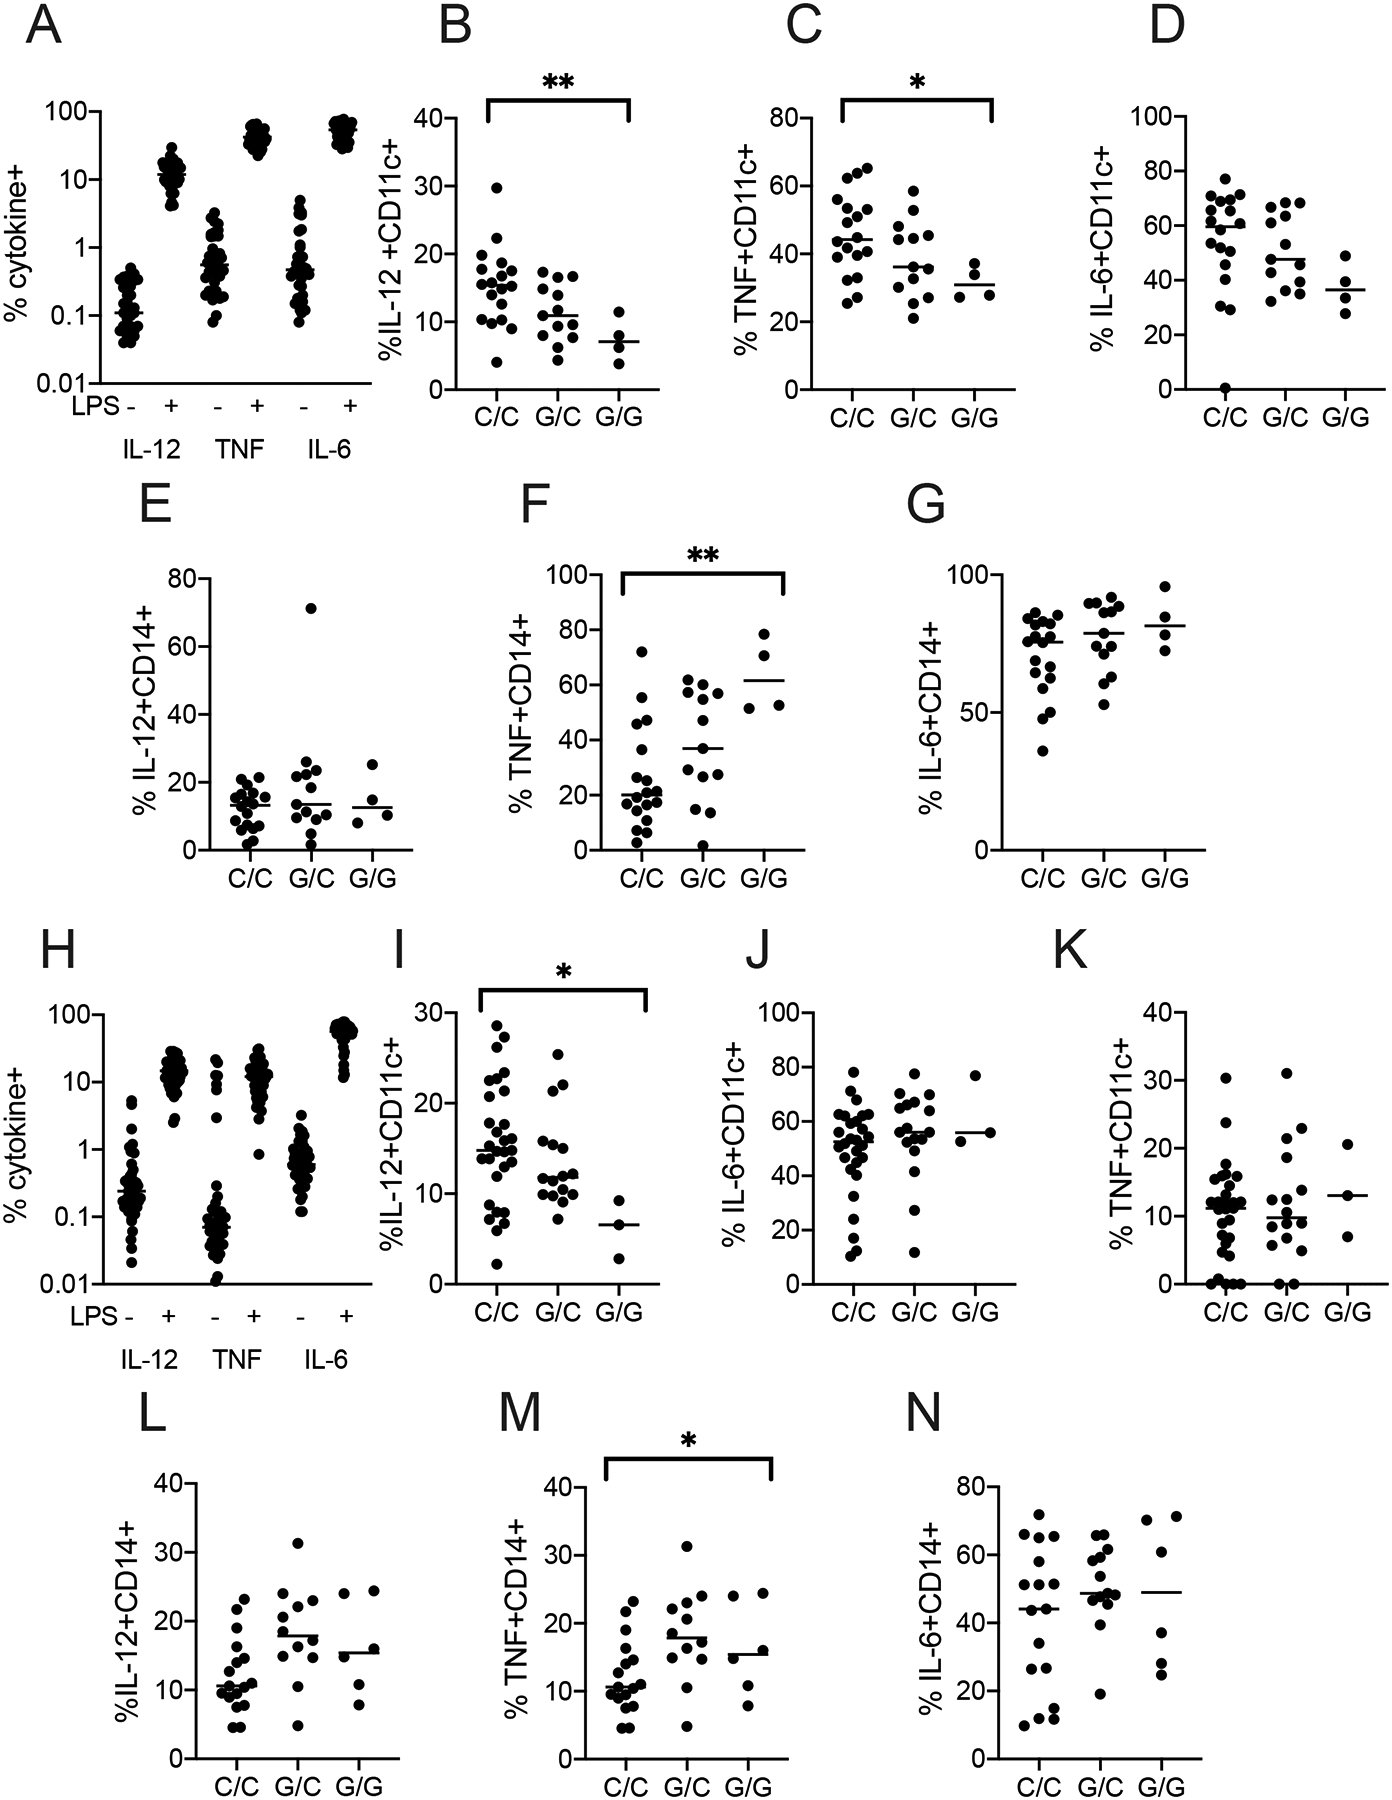
A) Proportion of peripheral blood DC (MHC-II+CD14-CD16-CD11c+) producing cytokines of interest from healthy volunteers (N=35), after media or LPS stimulation. Whole blood was drawn from healthy donors and immediately stimulated with LPS (10 ng/ml) for 6 hours in the presence of BFA and monensin.
B-D) Proportion of CD11c+ DC producing C) IL-12, D) TNF, or E) IL-6, stratified by SNP rs5743854.
E-G) Proportion of CD14+ monocytes producing F) IL-12, G) TNF, or H) IL-6, stratified by SNP rs5743854. N = 18 C/C genotype, 13 G/C genotype, and 4 G/G genotype.
H) Proportion of peripheral blood DC (n = 48) producing IL-12, TNF, or IL-6 after media or LPS (10ng/ml) stimulation in a second cohort for 24 hours.
I-K) Proportion of peripheral blood DC producing C) IL-12, D) TNF, or E) IL-6, stratified by SNP rs5743854.
L-N) Proportion of peripheral blood monocytes producing F) IL-12, G) TNF, and H) IL-6, stratified by SNP rs5743854. N = 29 C/C genotype, 16 G/C genotype, and 3 G/G genotype. Data are presented as scatterplots with bars indicating median value. We assessed statistical significance in each graph using a simple generalized linear model, encompassing all data in each subfigure. Graphs lacking bars had a p-value >0.05 using this statistical test. Each dot represents an overall measurement of the proportion of cytokine-producing cells from a single individual. *p < 0.05, **p < 0.01. Each experiment was performed at least twice; all data are shown.