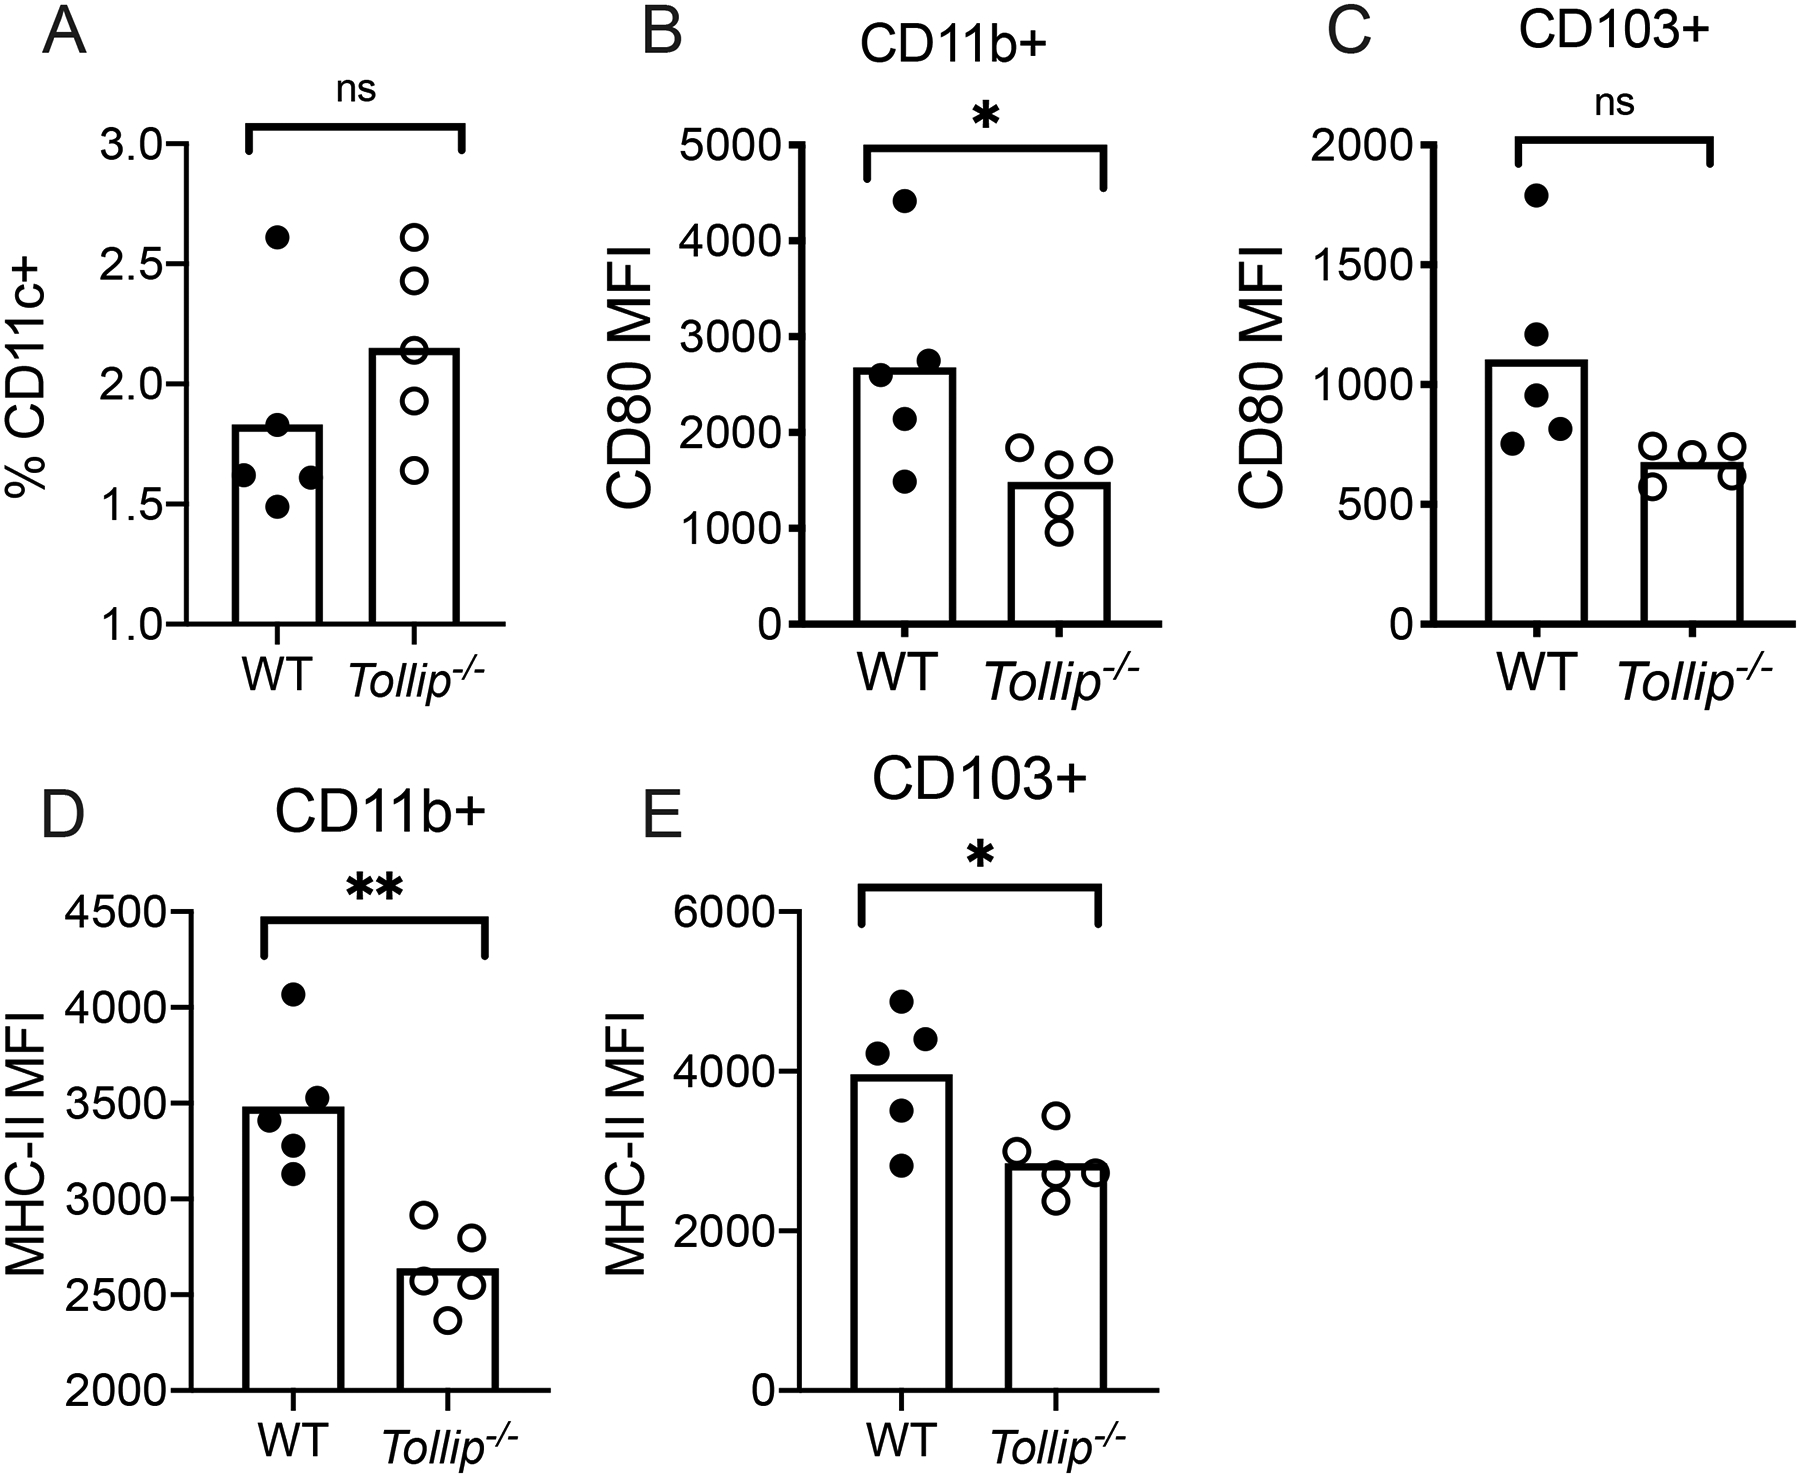
Figure 4. DCs from Tollip−/− mice demonstrate diminished CD80 expression during Mtb infection.

WT and Tollip−/− mice were infected with Mtb H37Rv strain via the aerosol method (50 CFU). Single cell homogenates of lung tissue were obtained 28 days after infection and DC populations were characterized. WT DC (black circles) were compared to Tollip−/− (clear circles) DC. Bars represent mean values.
A) Frequency of overall DC (MHCII+Ly6G-SiglecF-CD11c+) among total lung cell populations (live singlets) 28 days after Mtb infection.
B-C) Median fluorescence intensity (MFI) of CD80 on B) CD11b+ DC (MHCII+Ly6GSiglecF-CD11c+CD11b+) and C) CD103+ DC (CD103+CD11c+MHCII+CD11b-Ly6G-SiglecF-).
D-E) MHC Class II (H-2b) MFI on D) CD11b+ (MHCII+Ly6GSiglecF-CD11c+CD11b+) and E) CD103+ DC (CD103+CD11c+MHCII+CD11b-Ly6G-SiglecF-) by genotype. *p < 0.05, **p < 0.01, ***p < 0.001, unpaired t-test. Bars represent mean values. Dots represent individual values from a single experimental replicate. Data are representative of at least two independent experiments. All data are shown.
