
Figure 1. Downregulation of IFNAR1 on the intratumoral CTL undermines their activities.
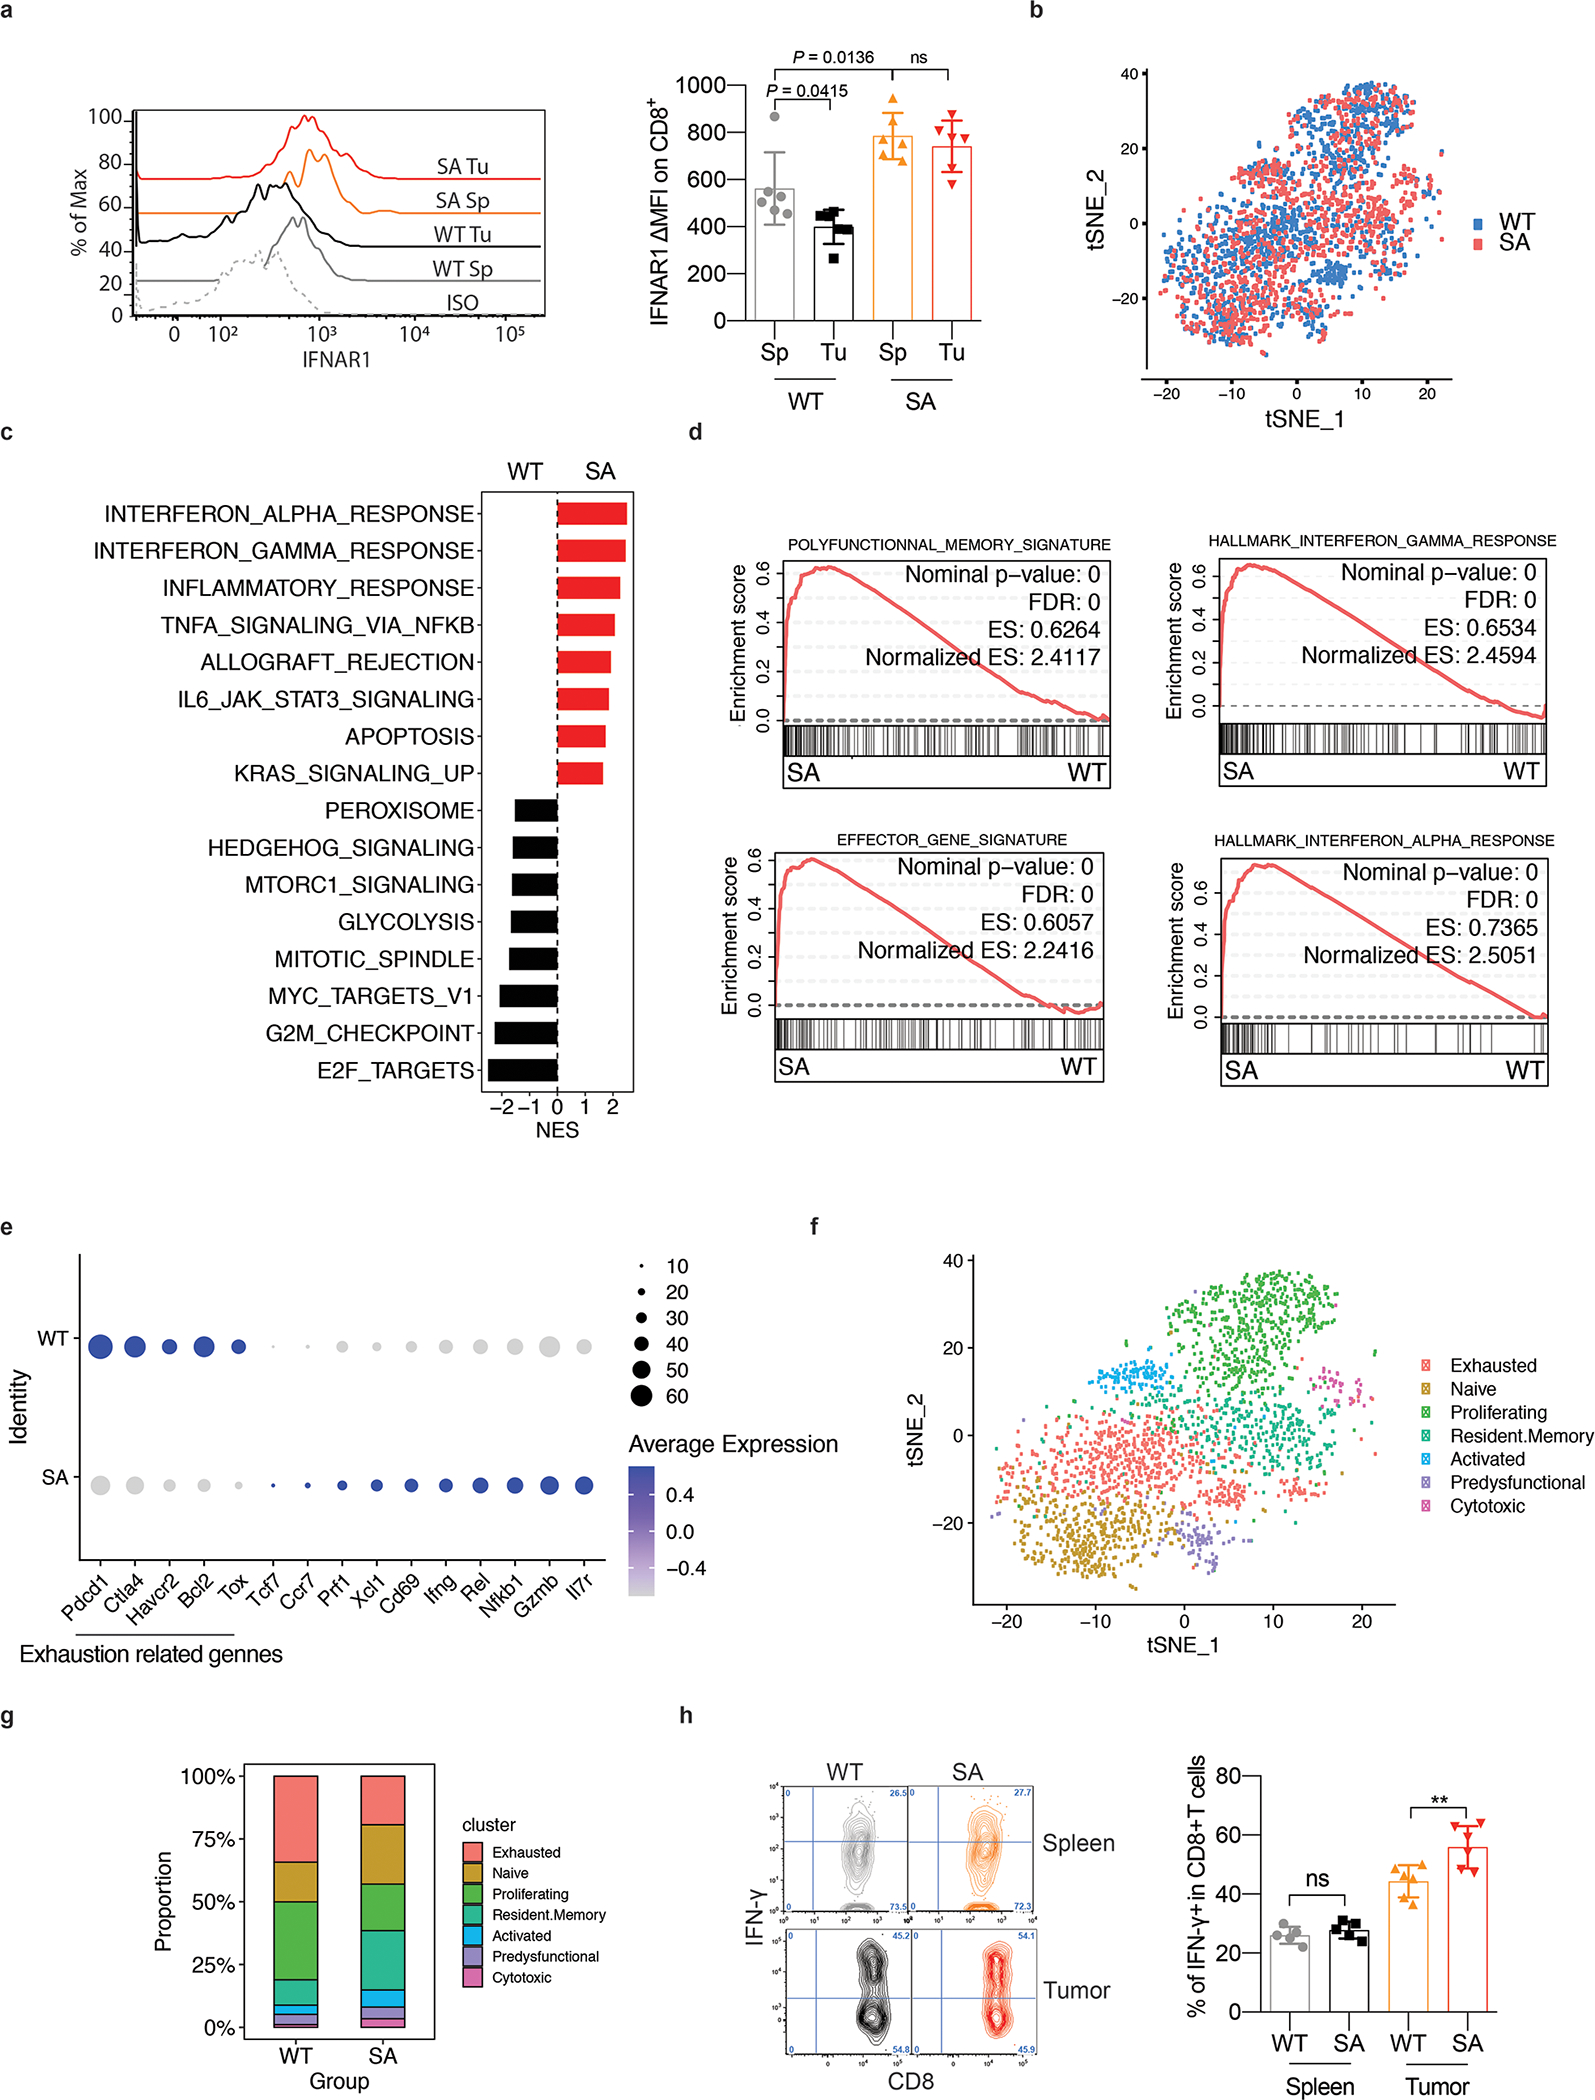
F. Flow cytometry analysis of IFNAR1 levels on the surface of CD45+CD3+CD8+ T cells in spleen (Sp) and tumor (Tu) tissues from WT or SA mice on day 21 after inoculation of s.c. MC38 tumors (1×10⁶ cells/mouse). Quantification data (on the right) are shown as mean ± SEM (n = 6 mice for each group). Statistical analysis was performed using ordinary one-way ANOVA with Tukey`s multiple comparisons test.
G. Immune cells were isolated from MC38 tumors growing in WT or SA mice on day 14 post-inoculation. N=9,725 cells were used for the scRNA-seq analyses. t-SNE plot of CD8+ T cells with clusters demarcated by colors demonstrating WT (blue, n = 2075 cells) and SA (red, n = 2038 cells).
H. Gene Set Enrichment Analysis (GSEA) of differentially expressed genes comparing CD8+ T cells in WT and SA groups. Black and red colors denote genesets enriched in WT and SA, respectively.
I. Leading-edge plots showing results from Gene Set Enrichment Analysis (GSEA) of CD8+ T cell function relevant genesets comparing CD8+ T cells in WT and SA groups.
J. Dot plot showing the expression of T cells exhaustion (underlined below) and function related genes. The size of the dot corresponds to the percentage of cells expressing the gene in each group and the color represents the average expression level. WT, n = 2075 cells; SA, n = 2038 cells.
K. t-SNE plot of CD8+ T cells with clusters demarcated by colors demonstrating seven clusters based on gene expression (as in Fig S1C).
L. t-SNE plot analysis of proportion of CD8+ T cell clusters (as in Fig 1F) in WT and SA samples. WT, n = 2075 cells; SA, n = 2038 cells.
M. Flow cytometry analysis of IFN-γ positive CD8+ T cells in naive spleens and tumor tissues from mice of indicated genotypes. Data are shown as mean ± SEM (WT and SA spleen, n = 5 mice; WT and SA tumor, n = 6 mice). Statistical analysis was performed using ordinary one-way ANOVA with Tukey`s multiple comparisons test. **P = 0.0050.