
Extended Data Fig. 5. PARP11 undermines tumoricidal activities of CAR T cells.
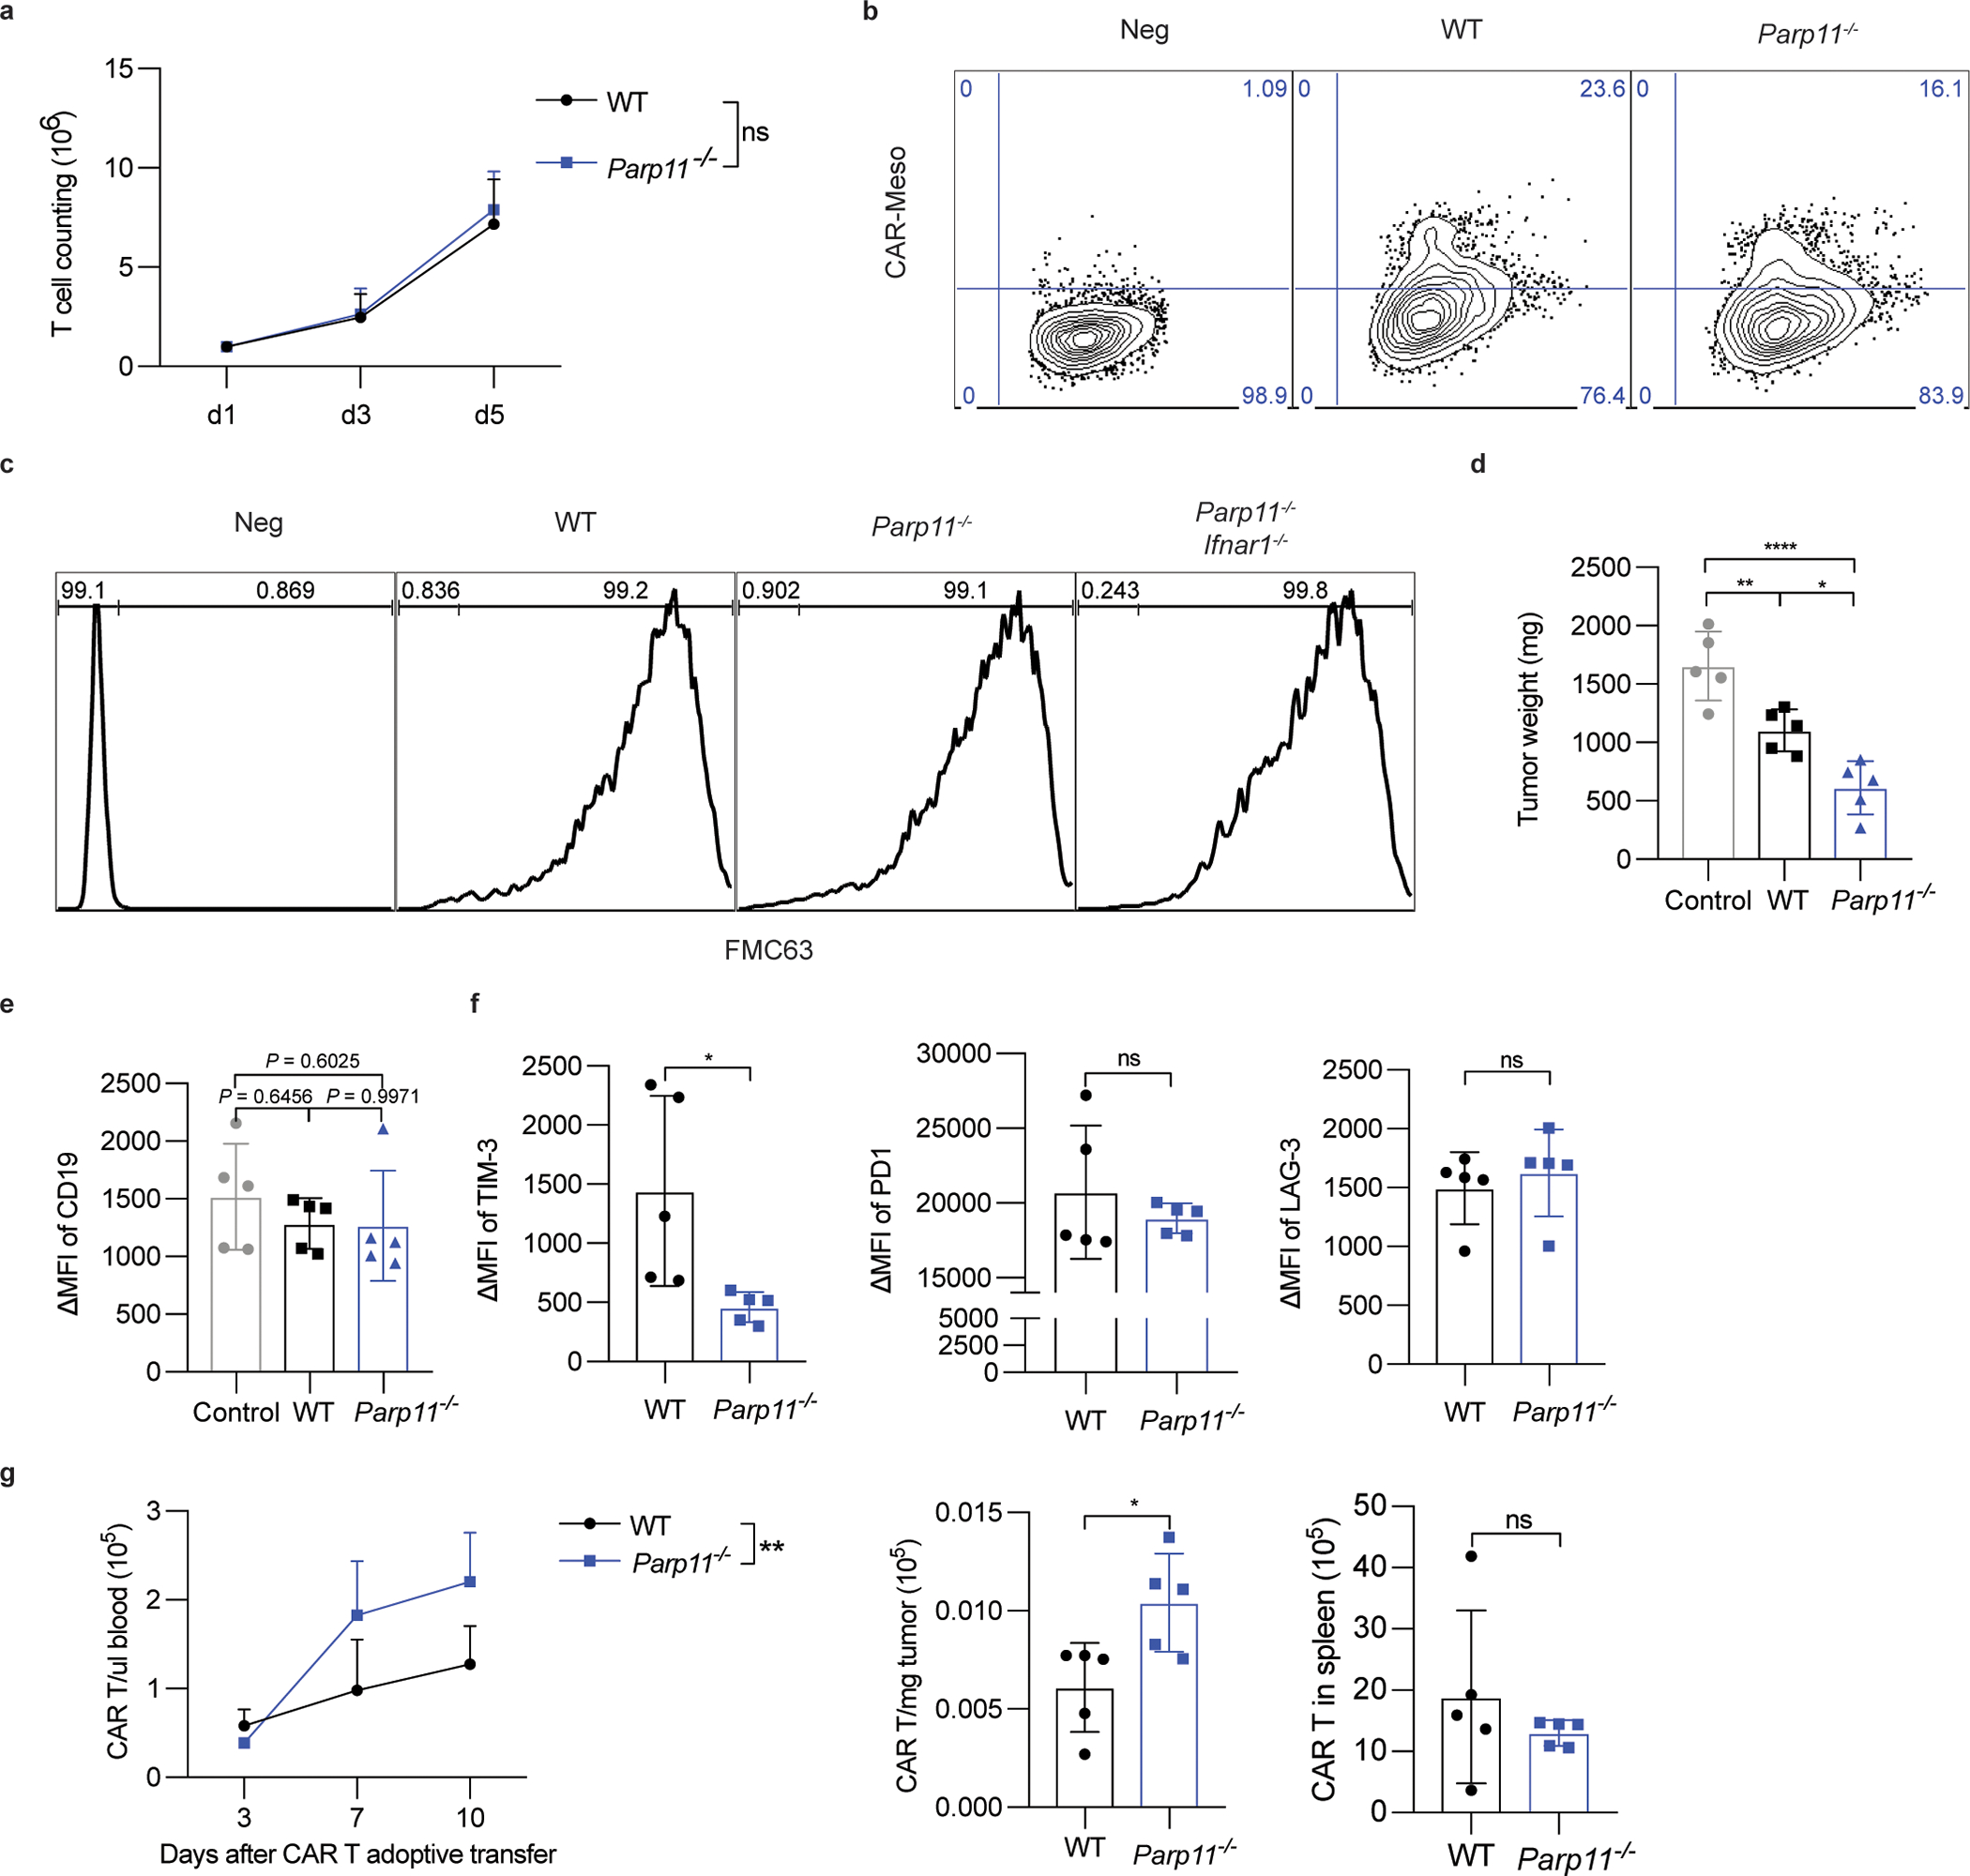
A. Proliferation of CD19-BBz CAR T cells prepared from WT or Parp11−/− mouse splenic T cells. Data are shown as mean ± SEM (n = 5 samples for each group). Statistical analysis was performed using two-way ANOVA with Tukey`s multiple comparisons test. ns, P = 0.6599.
B. Flow cytometry analysis of CAR expression in mouse T cells of indicated genotypes after Meso-BBz transduction.
C. Representative flow cytometry analysis of CAR expression in mouse T cells of indicated genotypes after CD19-BBz transduction.
D. Weight of hCD19-B16F10 s.c. tumors that grew in NSG mice treated with PBS (Control) or adoptively transferred with CD19-BBz CAR T cells (1×10⁶/ mouse, i.v) of indicated genotypes as in Fig 7D. Data are shown as mean ± SEM (n = 5 mice for each group). Statistical analysis was performed using ordinary one-way ANOVA with Tukey`s multiple comparisons test. **P = 0.0087, ****P < 0.0001, *P = 0.0175.
E. Cell surface expression of human CD19 on the surface of hCD19-B16F10 malignant cells is checked by flow cytometry. Data are shown as mean ± SEM (n = 5 mice for each group). Statistical analysis was performed using ordinary one-way ANOVA with Tukey`s multiple comparisons test.
F. Expression of TIM-3, PD-1, and LAG-3 exhaustion markers by WT or Parp11−/− CAR T cells isolated from hCD19-B16 subcutaneous tumors from mice described in Fig S5D. Data are shown as mean ± SEM (n = 5 mice for each group). Statistical analysis was performed using ordinary one-way ANOVA with Tukey`s multiple comparisons test. **P = 0.0270.
G. Numbers of WT or Parp11−/− CAR T cells in the blood, spleen or hCD19-B16 subcutaneous tumors from mice described in Fig S5D. Data are shown as mean ± SEM (n = 5 mice for each group). Statistical analysis was performed using ordinary one-way ANOVA with Tukey`s multiple comparisons test. **P = 0.0038, *P = 0.0212.