
Figure 6. Increased efficacy of CAR T cells engineered to inactivate PARP11.
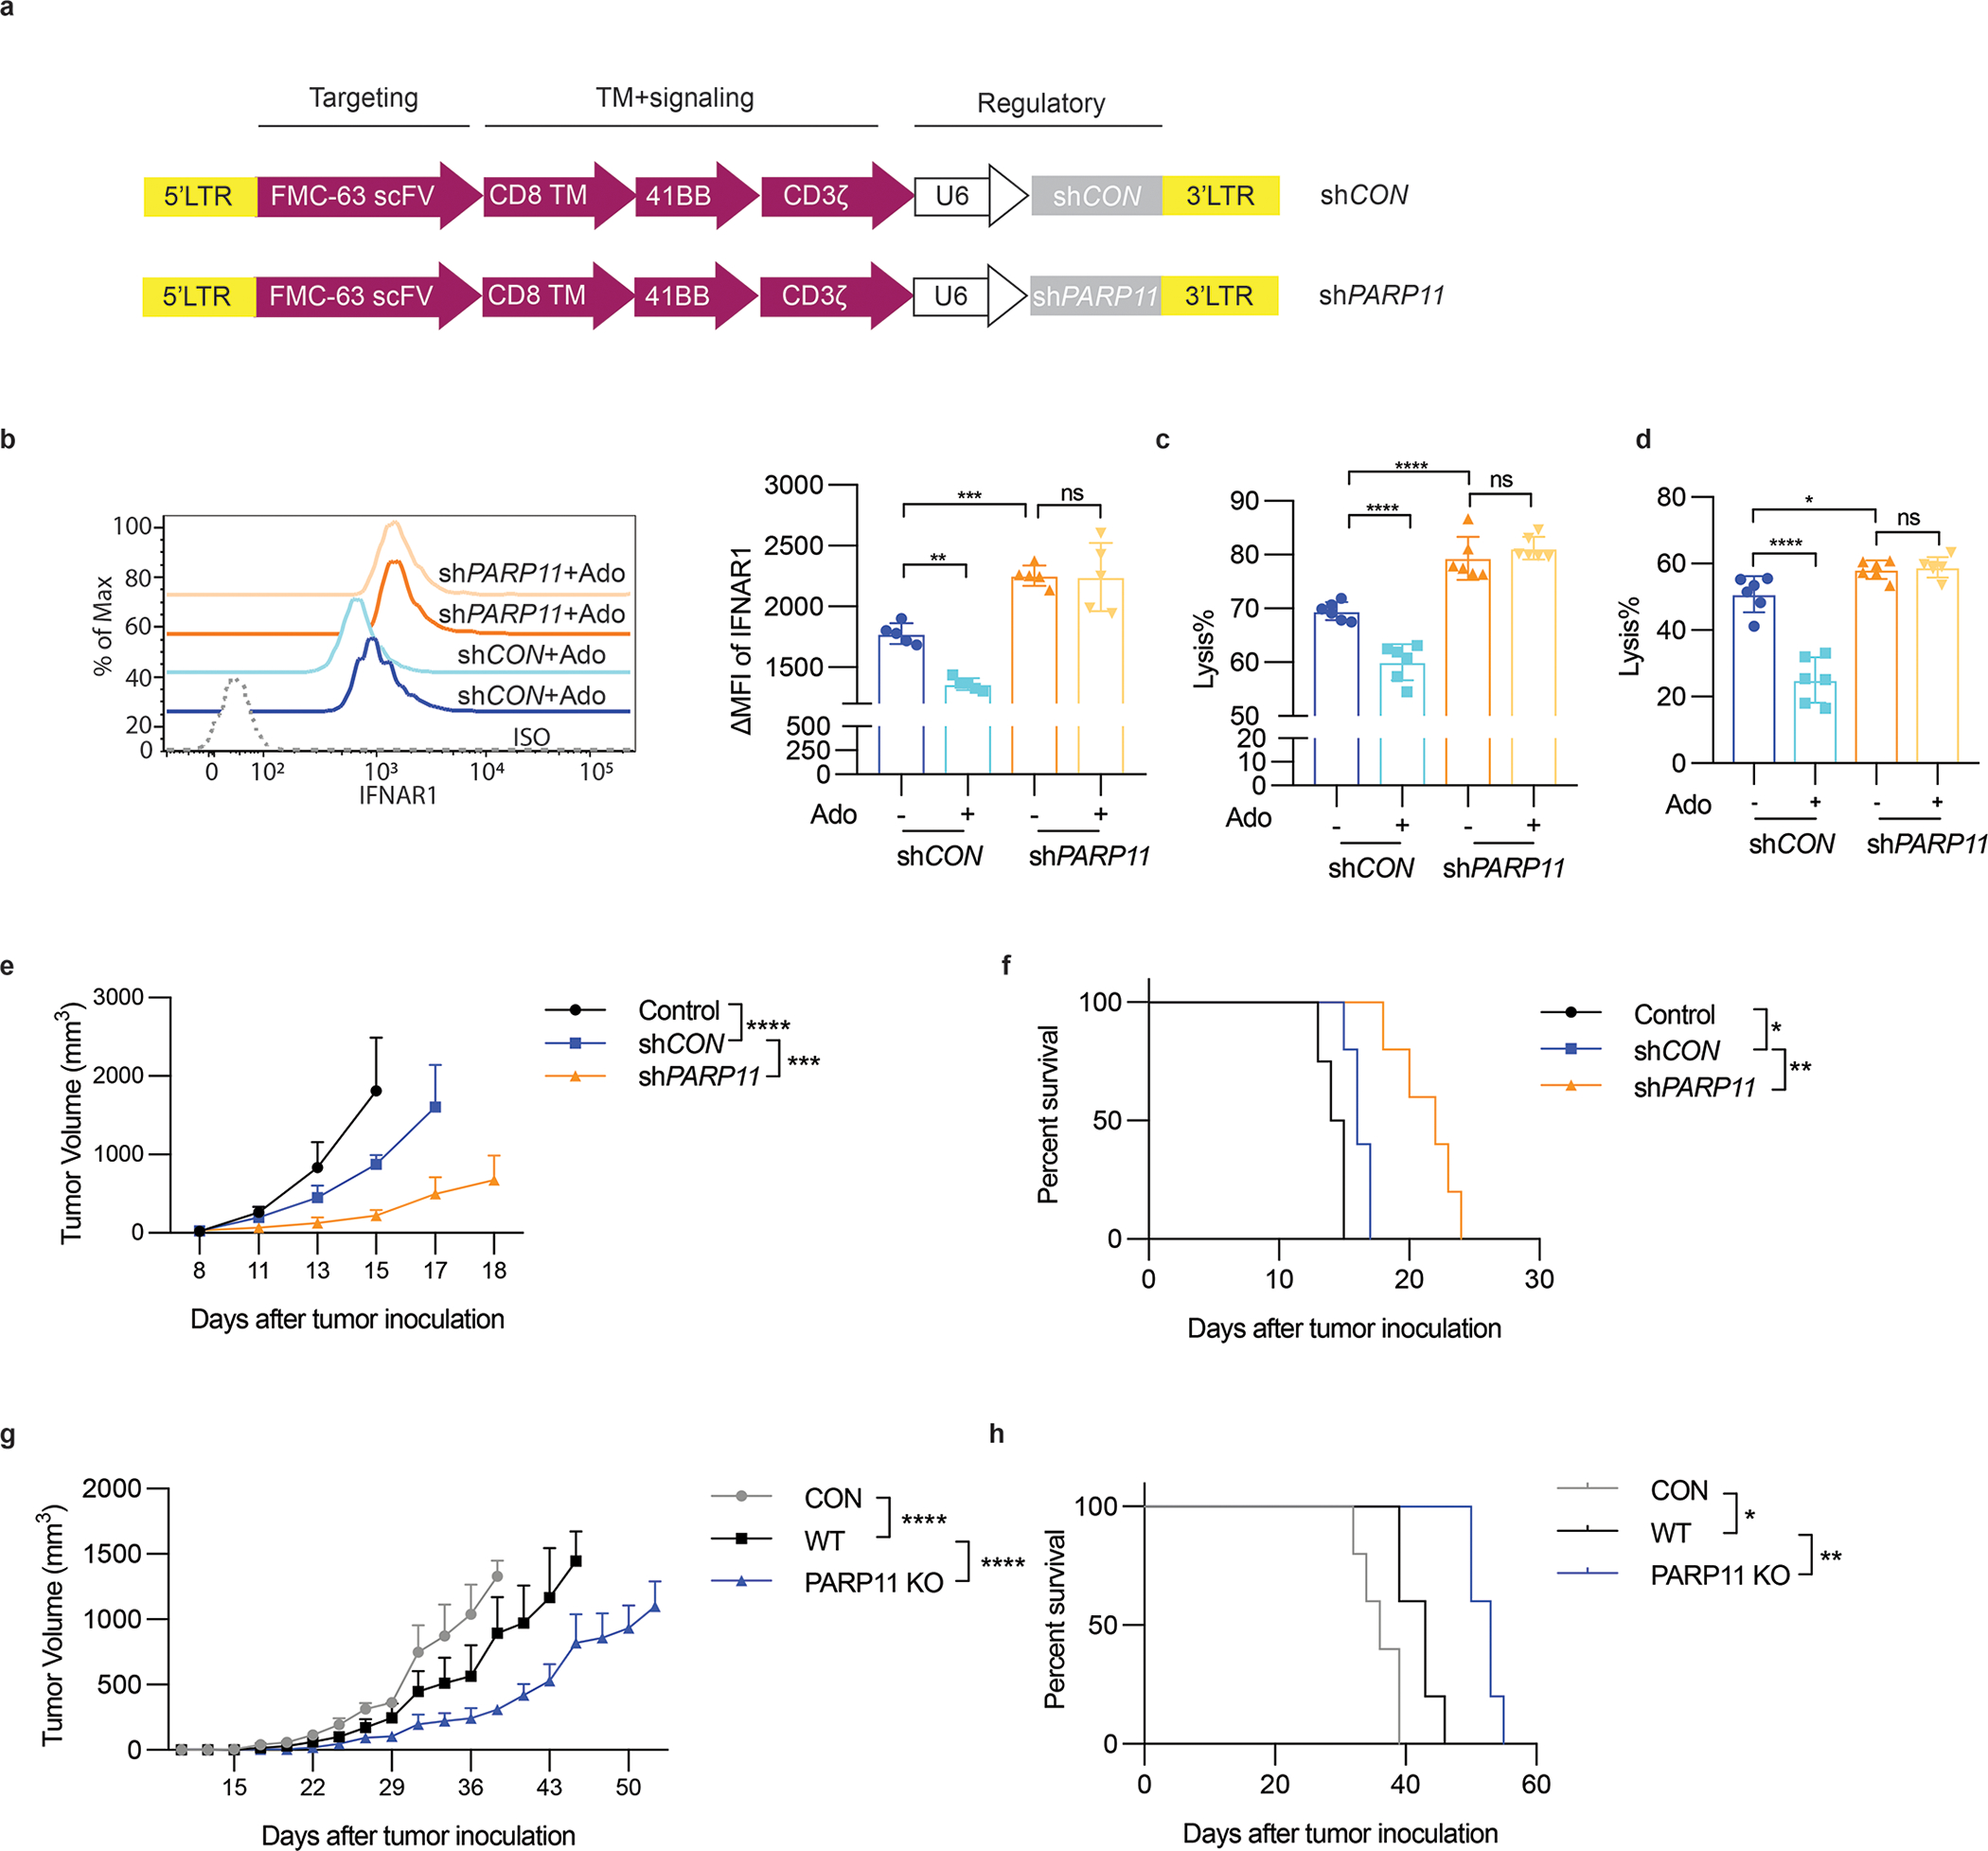
A. Schematic representation of shCON and shPARP11-CD19-BBz chimeric receptors.
B. Flow cytometry analysis of levels of IFNAR1 on the surface of indicated CAR T cells treated with or without adenosine (Ado, 1mM, 24h). Statistical analysis was performed using ordinary one-way ANOVA with Tukey`s multiple comparisons test. **P = 0.0033, ***P = 0.0009. n = 5 samples.
C. Lysis of hCD19-B16F10 cells by shCON-CD19-BBz or shPARP11-CD19-BBz CAR T cells treated with or without adenosine (Ado, 1mM, 24h). (E:T ratio=10:1). Statistical analysis was performed using ordinary one-way ANOVA with Tukey`s multiple comparisons test. ****P < 0.0001. n = 6 independently treated cell cultures.
D. Lysis of NALM6 cells that express endogenous CD19 by shCON-CD19-BBz or shPARP11-CD19-BBz CAR T cells treated with or without adenosine (Ado, 1mM, 24h). (E:T ratio=10:1). Statistical analysis was performed using ordinary one-way ANOVA with Tukey`s multiple comparisons test. ****P < 0.0001, *P = 0.0426. n = 6 independently treated cell cultures.
E. hCD19-B16F10 tumor growth in NSG mice inoculated with 5×10⁵ hCD19-B16 cells (s.c.) and 7 days later administered with indicated CAR T cells (1×10⁶/ mouse, i.v). Statistical analysis was performed using two-way ANOVA with Tukey`s multiple comparisons test. ****P < 0.0001, ***P = 0.0005. Con, n = 4 mice; shCon, n = 5 mice; shPARP11, n = 5 mice.
F. The Kaplan-Meier analysis of survival of animals from experiment described in Fig 6E (Con, n = 4 mice; shCon, n = 5 mice; shPARP11, n = 5 mice). Statistical analysis was performed using Log-rank (Mantel-Cox) test. *P = 0.0138, **P = 0.0026.
G. Growth of EM-Meso-GFP-Luc tumors (1×10⁶/mouse, s.c.) in NSG mice that were administered with control (PBS) or WT or PARP11 knockout Meso-BBz CAR T cells (1×10⁶/ mouse, i.v. on day 7). Statistical analysis was performed using two-way ANOVA with Tukey`s multiple comparisons test. ****P < 0.0001. n=5 mice.
H. The Kaplan-Meier analysis of survival of animals from experiment described in Fig. Statistical analysis was performed using Log-rank (Mantel-Cox) test. **P = 0.0019, *P = 0.0174. n = 5 mice.