
Extended Data Fig. 1. Downregulation of IFNAR1 on the intratumoral CTL undermines their activities.
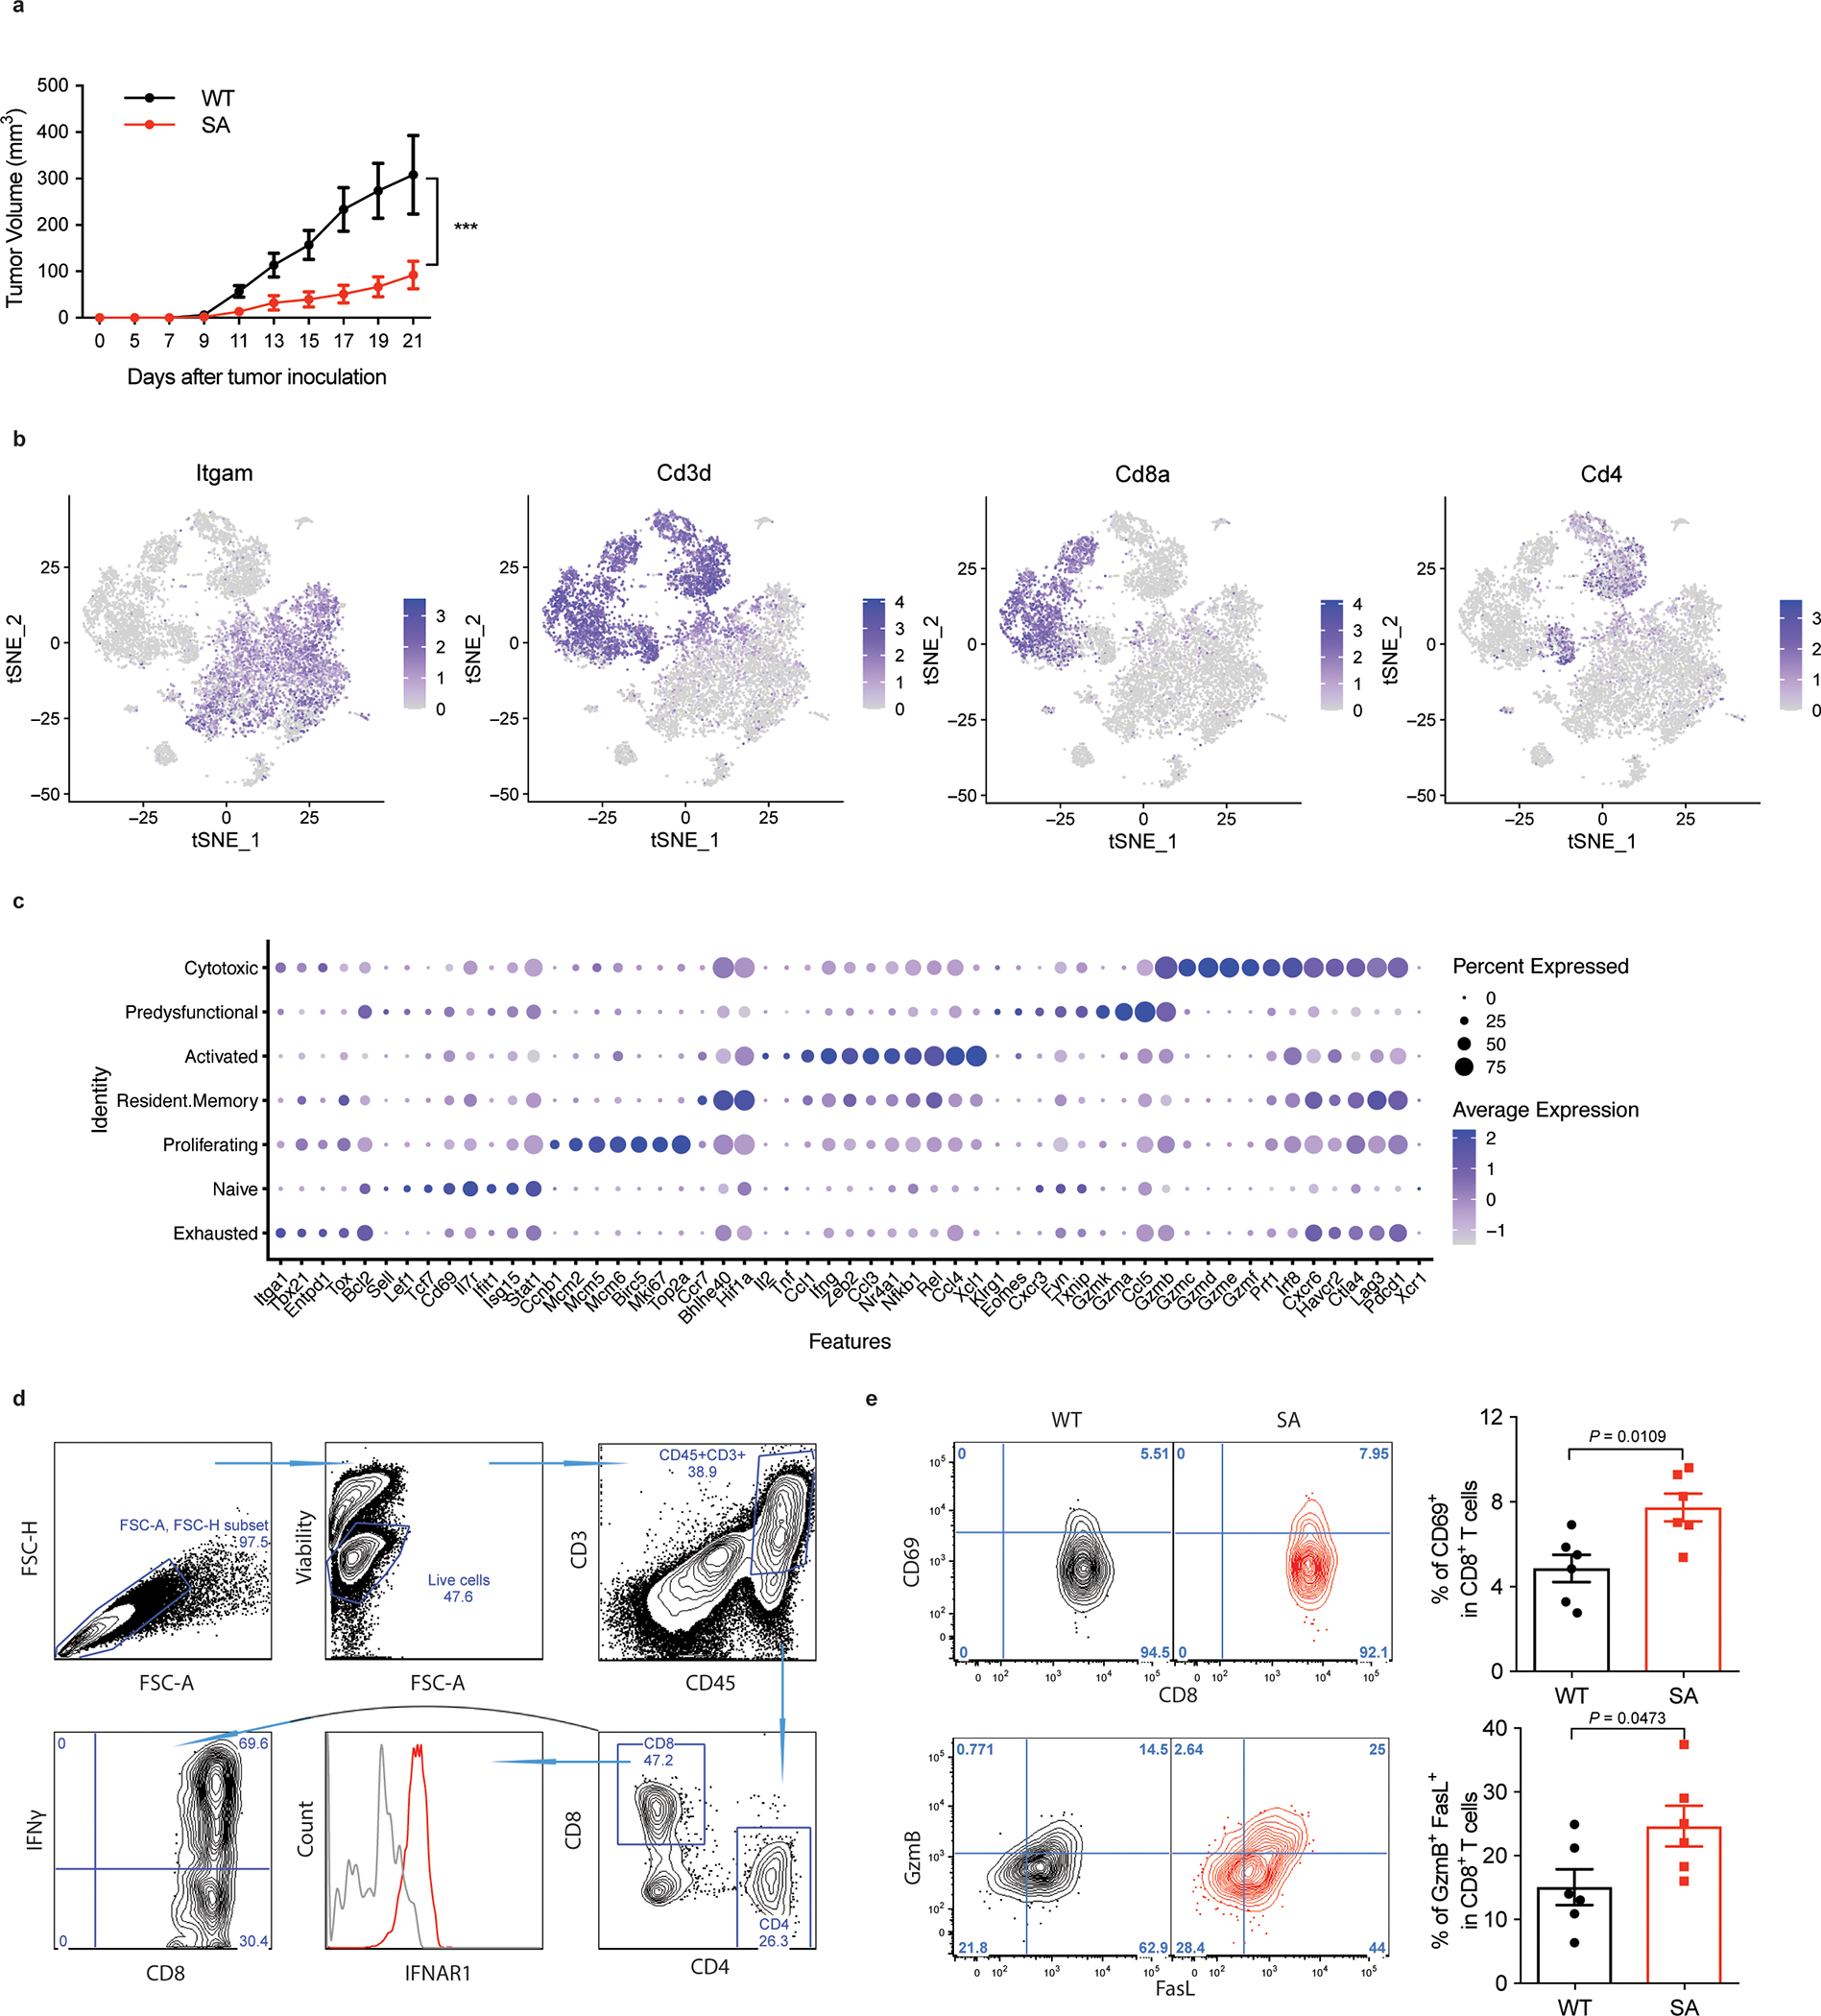
A. Growth of MC38 tumors (1×10⁶/mouse) after s.c. injection into WT and SA mice. Tumor volumes were measured 3 times per week. Data are shown as mean ± SEM (WT, n = 8 mice; SA, n = 5 mice). Statistical analysis was performed using two-way ANOVA with Tukey`s multiple comparisons test. ***P = 0.0004.
B. t-SNE plots showing the expression of Itgam, Cd3d, Cd8a and Cd4. Transcript levels are color-coded. N=9,725 cells.
C. Dot plots showing the expression of CD8+ T cell function relevant genes that are highly expressed in each cluster. The size of the dot corresponds to the percentage of cells expressing the gene in each group and the color represents the average expression level. WT, n = 2075 cells; SA, n = 2038 cells.
D. Flow cytometry gating strategies in analysis of cellular components of tumor tissues.
E. Flow cytometry analysis of CD69+ and FasL+ GzmB+ cells gated on CD45+CD3+CD8+ T cells in indicated tumor tissues. Data are shown as mean ± SEM (n = 6 mice for each group). Two-tailed unpaired t-test was performed for the comparisons between groups.