
Figure 4.
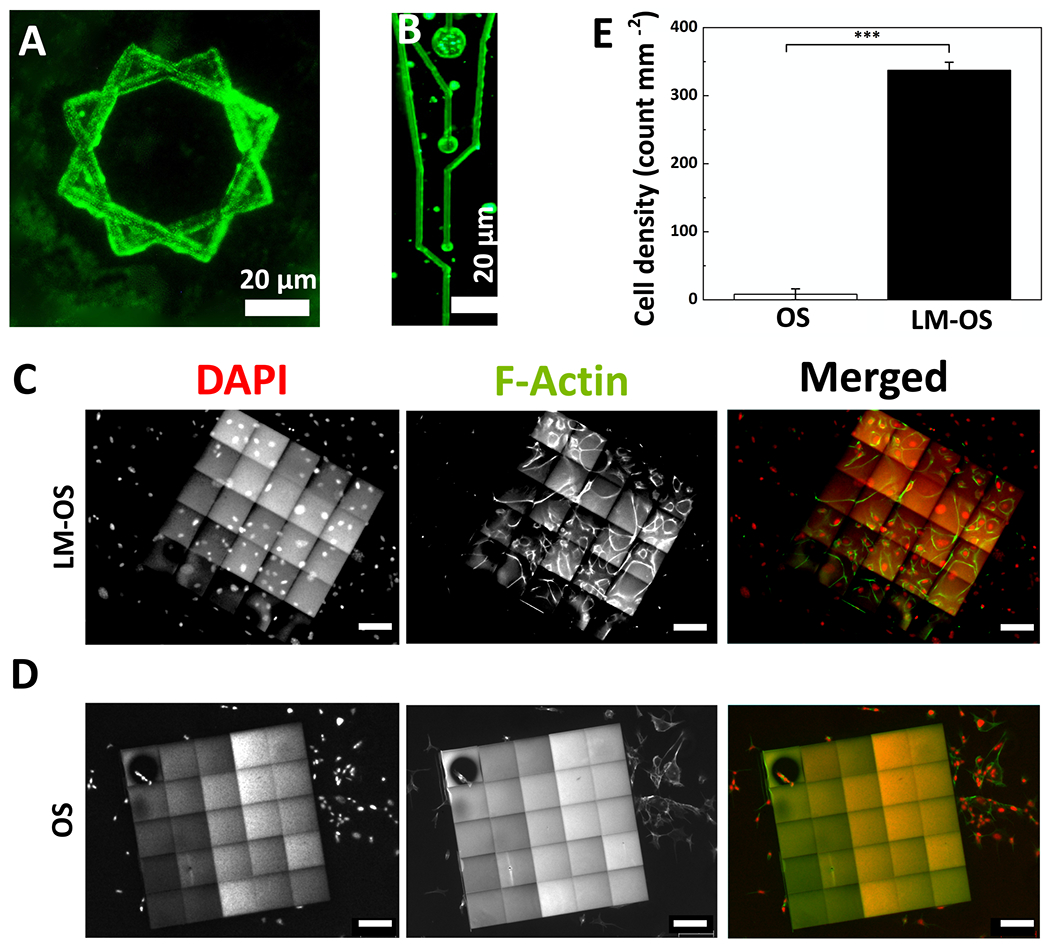
Incorporation of laminin (LM) into MPL-fabricated OSCMs. A and B) Fluorescent microscopy micrographs of LM-OSCMs showing the incorporation and distribution of LM. C and D) Representative epifluorescence micrographs of endothelial cells fixed and stained with Oregon Green 488 phalloidin (green) and DAPI (red) to visualize F-actin and cell nuclei, respectively after 48 hr cultured on LM-OS microstructures (C) and OS microstructures (without LM) (D) (scale bars: 100 μm). E) Quantification of (C) and (D) showing the cell density, data shown as mean ± SEM, n = 3, *** p<0.001.