Figure 6.

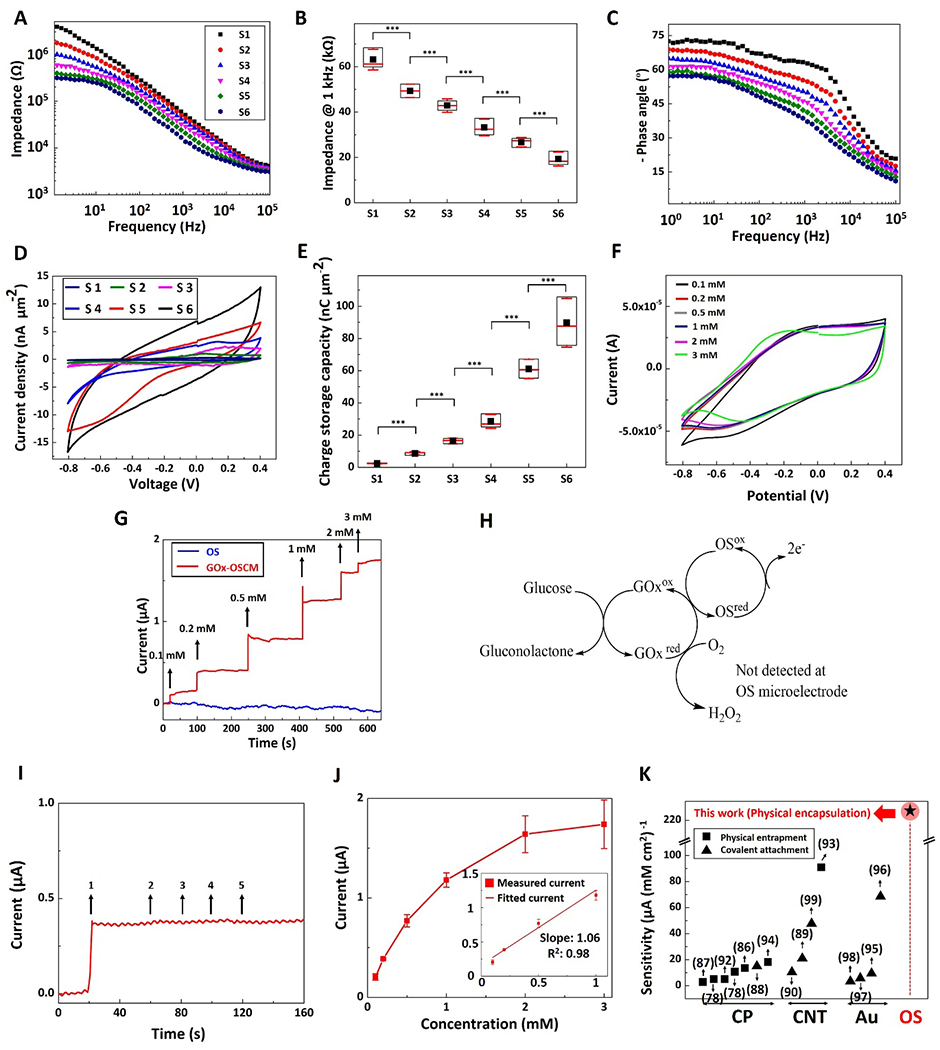
Electrochemical characterization and glucose biosensing using MPL-fabricated composite microelectrode sites. A) Impedance magnitude over a frequency range of 1-105 Hz for electrode sites with diameters of: 1 μm (S1, black squares), 5 μm (S2, red circles), 10 μm (S3, blue up-sided triangles), 20 μm (S4, magenta down-sided triangles), 40 μm (S5, green diamond), and 80 μm (S6, dark blue hexagon). B) Impedance of microelectrode sites at 1 kHz. Data shown as mean ± SD, n=3, *** p<0.001 C) Phase angle of the impedance spectrum over the frequency range of 1-105 Hz. D) Cyclic voltammetry of microelectrode sites, with potential swept from - 0.8 to 0.4 V and a scan rate of 0.1 V s−1. E) Charge storage capacity of the microelectrode sites. Data shown as mean ± SD, n=3, *** p<0.001. F) Cyclic voltammetry of a microelectrode site in various glucose concentrations: 0.1 mM (black), 0.2 mM (red), 0.5 mM (grey), 1 mM (blue), 2 mM (magenta), and 3 mM (light green). G) Amperometric current response of OS (blue) and GOx-OSCM (red) composite microelectrodes to successive glucose addition at polarization potential of + 0.3 V vs. Ag/AgCl. H) Proposed detection mechanism of glucose using MPL fabricated GOx-OSCMs: electrons are transferred from glucose to the OS microelectrodes at + 0.3 V vs. Ag/AgCl. I) Amperometric current response of a GOx-OSCM composite microelectrode to addition of (1) glucose (0.2 mM), (2) acetaminophen (0.1 mM), (3) ibuprofen (0.1 mM), (4) ascorbic acid (0.1 mM), and (5) urea (0.1 mM), sequentially. J) The response curve (calibration curve) of the biosensor showed an operating range within 0.1-3 mM glucose concentration (dynamic range of current response 0-2 μA), with a sensitivity of 232.9 ± 22.5 μA mM−1 cm−2 between 0.1 and 1 mM as shown in figure inset. Data shown as mean ± SEM, n=4. K) Sensitivity of glucose biosensors (based on literature search) for different electroactive materials based on amperometric detection of glucose (CP: conducting polymers, CNT: carbon nanotubes, Au: gold, and OS: organic semiconductor). Black squares and black triangles demonstrate physical entrapment and covalent attachment, respectively. Star with red circle background represents the sensitivity of our novel sensor based on physical encapsulation of GOx in OS composite polymer). In (B) and (E), data are represented in box graphs where the black squares, red lines, and red whiskers demonstrate average, median, and standard deviation, respectively.
