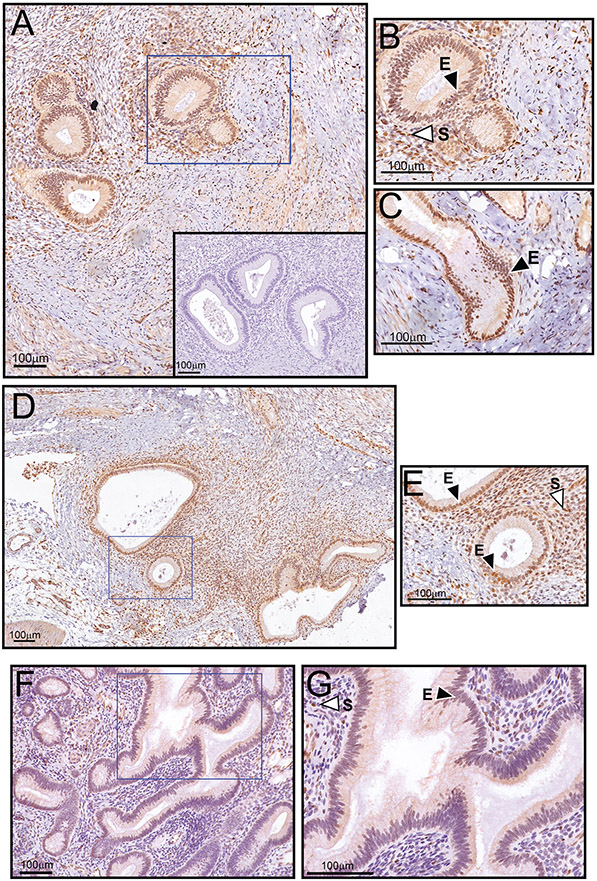
Figure 1.
Significant EGR1 protein expression in epithelial and stromal cells of baboon ectopic endometriotic lesions. (A) Low power magnification image of an endometriotic lesion biopsied from the pelvic region of the baboon. Note the strong expression of EGR1 in the glandular epithelium and underlying stroma. The inset shows negative control staining, which does not include the primary antibody against EGR1. (B) Higher magnification image of a region demarcated with a blue box in (A); the epithelium and stroma are denoted by “E” and “S” respectively. (C) Higher magnification image of an elongated epithelial gland within the same endometriotic lesion (outside the field shown in (A)). Again, note the marked immunoreactivity for EGR1 in all epithelial cells that comprise the gland. (D) Low power magnification image of an endometriotic lesion in the peritoneal region. Again, note the significant EGR1 immunopositivity within the endometriotic lesion. (E) Higher power magnification image of a region delineated by the blue box in (D). Again, note the strong expression for EGR1 in the epithelial and stromal compartments that comprise the endometriotic lesion. (F) Matched eutopic endometrium exhibits significantly lower EGR1 expression in the epithelial and stromal compartments. (G) Higher magnification image of the region outlined by the blue box in (F). Note that the eutopic uterus and both ectopic endometriotic lesions shown are derived from the same animal during the secretory phase of the cycle (see: Materials and methods sub-section). The data are representative of a group size of n=4.

