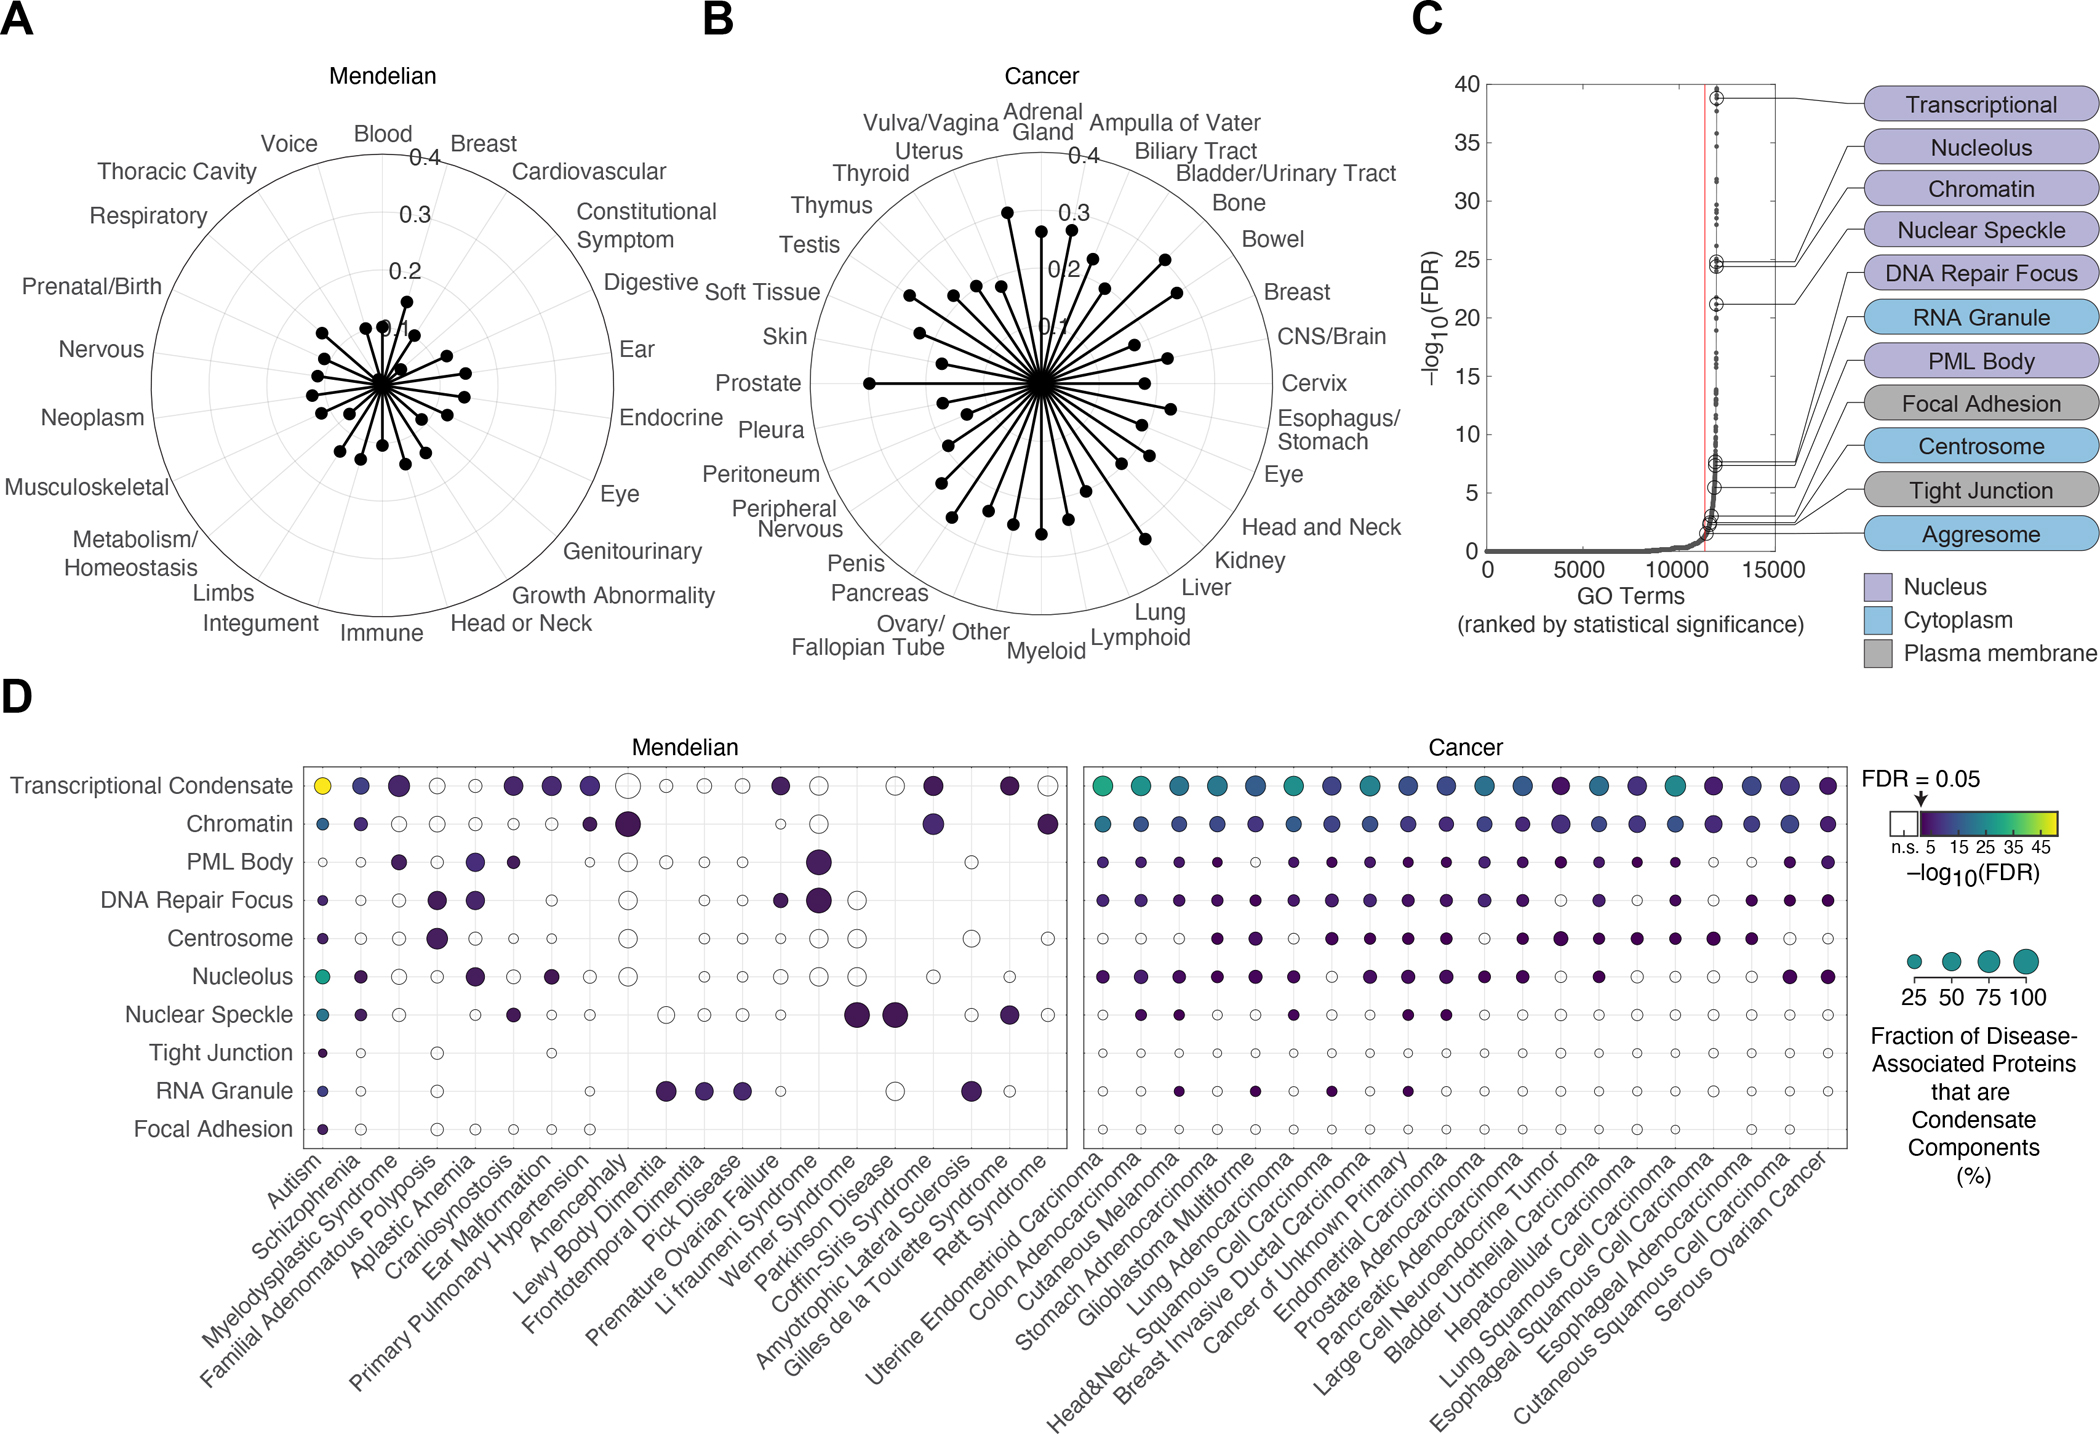
Figure 2. Condensate dysregulation across the spectrum of disease. See also Table S4I–K.

A. Proportion of pathogenic mutations (depicted as distance from center of radar plot) affecting condensate-promoting features in multivalent proteins across Mendelian diseases. Mendelian diseases are stratified by organ systems in which the diseases had a phenotypic effect (Methods).
B. Proportion of pathogenic mutations (depicted as distance from center of radar plot) affecting condensate-promoting features in multivalent proteins across cancers. Cancers are stratified by tissues of origin (Methods).
C. Enrichment of GO terms among the set of condensate-forming proteins that have pathogenic mutations that affect condensate-promoting features. GO terms (black dots) are ranked (x-axis) by statistical significance (−log10(FDR), y-axis). Red line denotes GO term rank corresponding to threshold for statistical significance (FDR < 0.05). The subset of significantly enriched GO terms that correspond to biomolecular condensates (Table S4I) are highlighted (black open circles and labels). Nuclear, cytoplasmic, and plasma membrane-associated condensates are indicated by purple, blue, or gray labels, respectively.
D. Significant associations between specific diseases and specific condensates. The set of condensate-forming proteins with pathogenic mutations affecting condensate-promoting features were mapped to specific condensates using Gene Ontology (see Methods) as well as associated with specific diseases. Overlaps between subsets of proteins associated with specific condensates (y-axis) and those associated with specific diseases (x-axis) were tested for statistical significance. Selected examples of Mendelian diseases (left) and cancer types (right) are shown (see also Table S4J–K). Filled data points correspond to a statistically significant association between the indicated disease with the indicated condensate, with the data point color corresponding to the Benjamini-Hochberg adjusted p-value (FDR) for the enrichment of proteins defined as components of the indicated condensate based on GO (Methods) among the set of condensate-forming proteins that have pathogenic mutations involved in the indicated disease that affect condensate-promoting features. Unfilled datapoints correspond to a lack of a statistically significant enrichment. Size of data point is proportional to the fraction of the indicated disease-associated condensate-forming proteins that are components of the indicated condensates.
