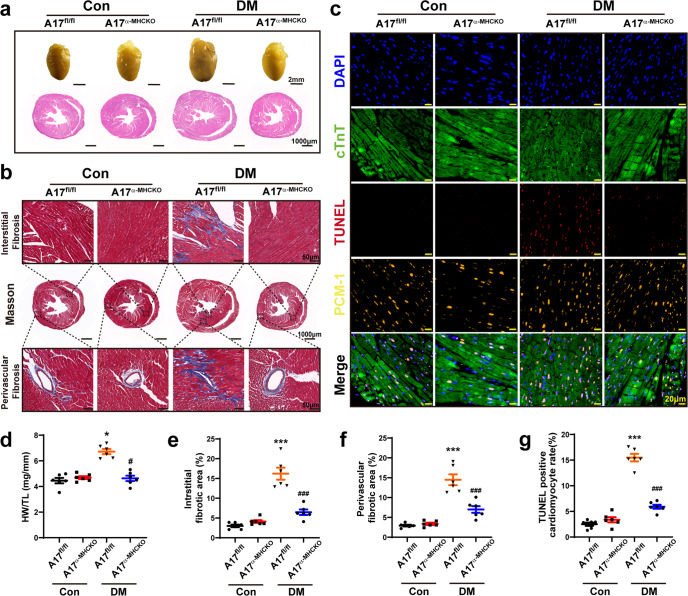
Fig. 2.
Histological and immunohistochemical staining in four groups of mice. a Representative images of hearts and myocardial cross-sections in four groups of mice: representative heart pictures (scale bar: 2 mm) were shown in the upper panel; Representative H&E staining of myocardial cross-sections (scale bar: 1000 μm) were shown in the lower panel. b Representative Masson’s trichrome staining of myocardial fibers. Masson’s trichrome staining of cardiac short-axis cross sectional areas (scale bar: 1000 μm) were shown in the middle panel. Dotted boxes in the middle panel indicated a local area in the low magnification field (scale bar: 1000 μm), which was enlarged in the high magnification field (scale bar: 50 μm) in the bottom panel. The interstitial fibrosis images were shown in the top panel and the perivascular fibrosis images were shown in the bottom panel. c Representative TUNEL-positive cardiomyocyte staining in mice (scale bar: 20 μm). d Quantitative analysis of heart weight/tibial length (HW/TL) ratio in mice, n = 6. e and f Quantification of the interstitial and perivascular fibrosis area in mice, n = 6. g Quantification of TUNEL-positive cardiomyocytes in mice, n = 6. Data were expressed as mean ± SEM. *P < 0.05, ***P < 0.001 vs. the A17fl/fl control group; #P < 0.05, ###P < 0.001 vs. the A17fl/fl DM group.

