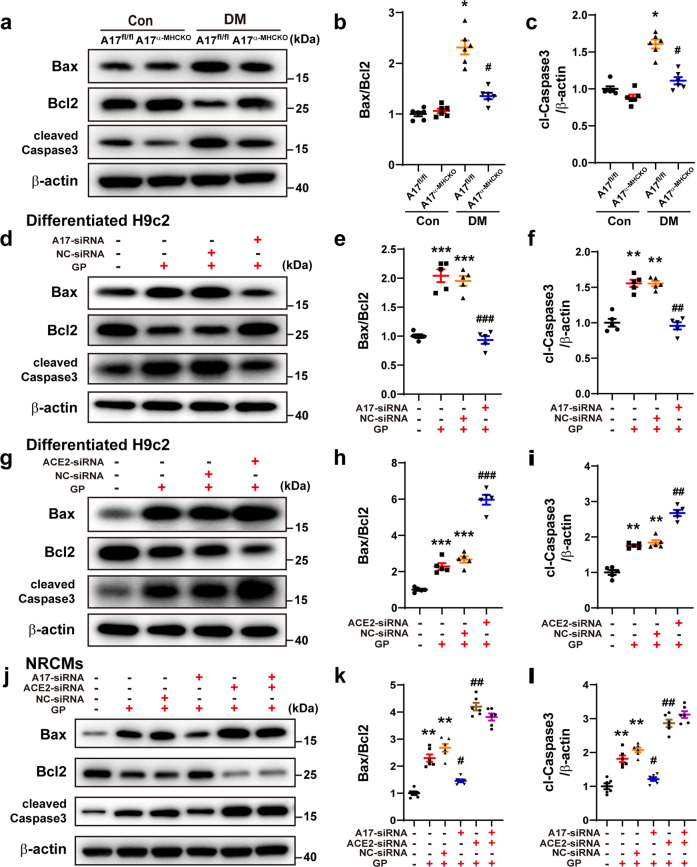
Fig. 3.
Effects of ADAM17 and ACE2 on apoptosis in mice, differentiated H9c2 cells and NRCMs. a Representative Western blot images of Bax, Bcl2, and cleaved caspase-3 expression in the myocardium of four groups of mice. b, c Quantitative analysis of Bax/Bcl2 and cleaved caspase-3 expression in four groups of mice, n = 6. Data were shown as mean ± SEM. *P < 0.05 vs. the A17fl/fl control group; #P < 0.05 vs. the A17fl/fl DM group. d–f Representative Western blot images of Bax, Bcl2, and cleaved caspase three expression and quantitative analysis of Bax/Bcl2 and cleaved caspase three expression in four groups of differentiated H9c2 cells treated with vehicle, GP, GP + NC-siRNA and GP + ADAM17-siRNA, respectively. Mean values were derived from five independent experiments. g–i Representative Western blot images of Bax, Bcl2, and cleaved caspase-3 expression and quantitative analysis of Bax/Bcl2 and cleaved caspase-3 in four groups of differentiated H9c2 cells treated with vehicle, GP, GP + NC-siRNA and GP + ACE2-siRNA, respectively. Mean values were derived from five independent experiments. Data were expressed as mean ± SEM. **P < 0.01, ***P < 0.001 vs. the vehicle group; ##P < 0.01, ###P < 0.001 vs. the GP + NC-siRNA group. j Representative Western blot images of Bax, Bcl2, and cleaved caspase-3 expression in six groups of NRCMs treated with vehicle, GP, GP + NC-siRNA, GP + ADAM17-siRNA, GP + ACE2-siRNA and GP + ADAM17-siRNA+ACE2-siRNA, respectively. k, l Quantitative analysis of Bax/Bcl2 and cleaved caspase-3 expression in six groups of NRCMs. Mean values were derived from six independent experiments. Data were presented as mean ± SEM. **P < 0.01 vs. the vehicle group; #P < 0.05, ##P < 0.01 vs. the GP + NC-siRNA group.

