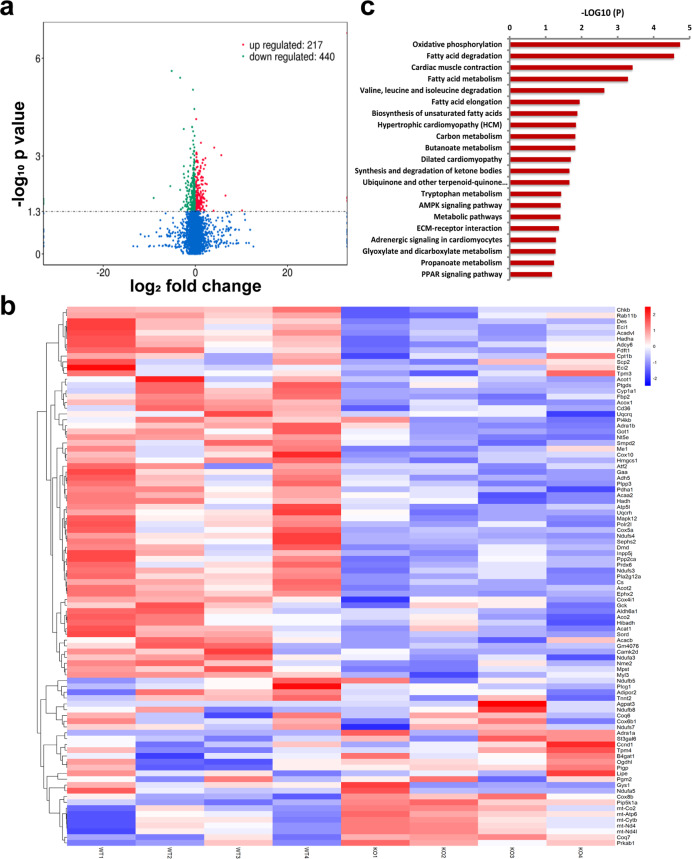
Fig. 5.
RNA-sequencing analysis of myocardial tissues in mice. a Volcano plot showing the transcript expression profiles in the hearts of A17α-MHCKO and ADAM17fl/fl diabetic mice, respectively. The horizontal line marked the threshold (P < 0.05) for defining upregulated (red dot) or downregulated (blue dot) genes in the myocardium of A17α-MHCKO diabetic mice. The x-axis indicated log2 fold change and the y-axis indicated −log10 P-values. b Hierarchical clustering of the top 50 (ranked by P-values) genes differentially expressed in hearts from the A17α-MHCKO and ADAM17fl/fl diabetic mice. c KEGG pathway enrichment analysis of differential expression (DE) transcripts in the heart. The DE transcripts falling into the top pathways were summarized. The x-axis indicated –log10 (P-values) of the pathway and the y-axis displayed functional pathways

