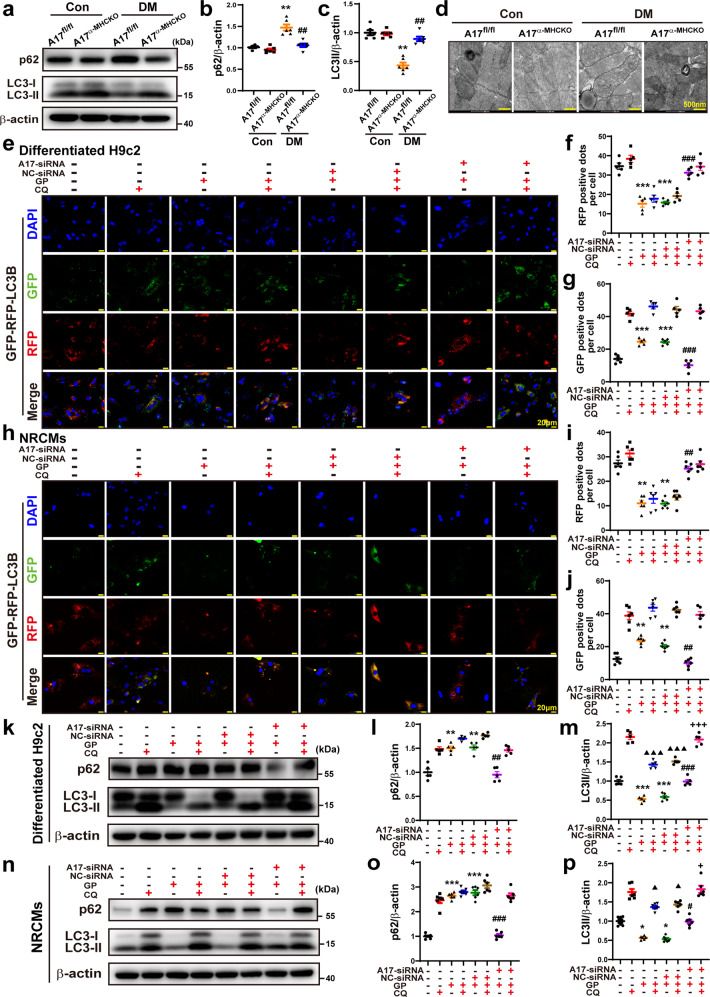
Fig. 8.
Effects of ADAM17 deficiency on cardiomyocyte autophagy in vivo and in vitro and on autophagic flux in differentiated H9c2 cells and NRCMs. a Representative Western blot images of autophagy-related protein expression, including p62 and LC3 in the myocardium of four groups of mice. b, c Quantitative analysis of protein expression of p62 and LC3II/β-actin in the myocardium of four groups of mice, n = 6. Data were shown as mean ± SEM. **P < 0.01, vs. the A17fl/fl control group; ##P < 0.01 vs. the A17fl/fl DM group. d Representative transmission electron microscopy images of the myocardium in four groups of mice (scale bar: 500 nm). e Representative fluorescence images of green fluorescent protein (GFP; green), red fluorescent protein (RFP; red), GFP-RFP-LC3 (merged: yellow) and nuclei stained with DAPI (scale bar: 20 μm) in eight groups of differentiated H9c2 cells treated with vehicle, GP, GP + NC-siRNA and GP + ADAM17-siRNA, with and without additional CQ treatment, respectively. f, g Quantitative analysis of RFP-positive and GFP-positive dots per cell in differentiated H9c2 cells. Mean values were derived from five independent experiments. h Representative fluorescence images of GFP-RFP-LC3 in eight groups of NRCMs treated as above. i, j Quantitative analysis of RFP-positive and GFP-positive dots per cell in NRCMs. Mean values were obtained from six independent experiments. k Representative Western blot images of p62 and LC3 protein expression in eight groups of differentiated H9c2 cells treated as above. l and m Quantitative analysis of protein expression of p62 and LC3II/β-actin in differentiated H9c2 cells. Five independent experiments were performed to calculate the means. n Representative Western blot images of p62 and LC3 protein expression in eight groups of NRCMs treated as above. o and p Quantitative analysis of protein expression of p62 and LC3II/β-actin in NRCMs. Mean values were derived from six independent experiments. Data were expressed as mean ± SEM. *P < 0.05, **P < 0.01, ***P < 0.001 vs. the vehicle group; #P < 0.05, ##P < 0.01, ###P < 0.001 vs. the GP + NC-siRNA group; ▲P < 0.05, ▲▲▲P < 0.001 vs. the CQ group; +P < 0.05, +++P < 0.001 vs. the GP + CQ + NC-siRNA group

