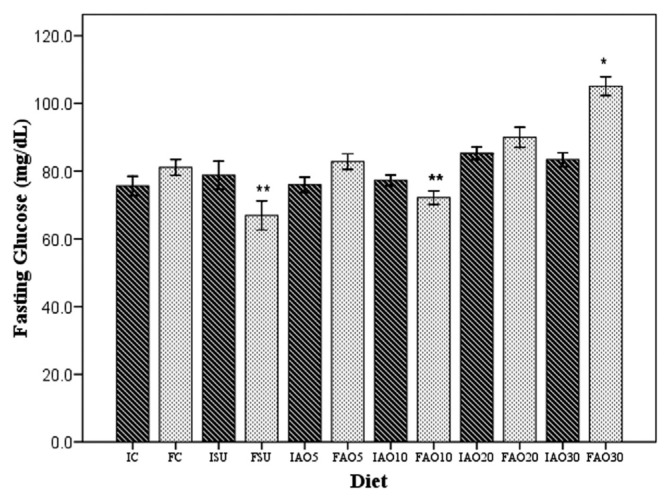
Figure 3.
The fasting blood glucose levels at the beginning and the end of the study. The figure shows the means of the fasting blood glucose levels obtained at the beginning (dark-shaded bars) and the end (light-shaded bars) of the 8-week study period. The letters and numbers represent the different groups and moment in time: FAO5 = final standard diet plus sucrose and 5% avocado oil; FAO10 = final standard diet plus sucrose and 10% avocado oil; FAO20 = final standard diet plus sucrose and 20% avocado oil; FAO30 = final standard diet plus sucrose and 30% avocado oil; FC = final control; FSU = final standard diet plus sucrose; IAO5 = initial standard diet plus sucrose and 5% avocado oil; IAO10 = initial standard diet plus sucrose and 10% avocado oil; IAO20 = initial standard diet plus sucrose and 20% avocado oil; IAO30 = initial standard diet plus sucrose and 30% avocado oil; IC = initial control; ISU = initial standard diet plus sucrose. *p < 0.05 (final blood glucose level compared with all the rat groups, calculated by one-way analysis of variance and the Scheffé post hoc test). **p < 0.05 (final blood glucose level in comparison with the standard diet plus sucrose and AO10 groups by Student t test). AO10 = group received standard diet plus sucrose and avocado oil at a concentration of 10%.

