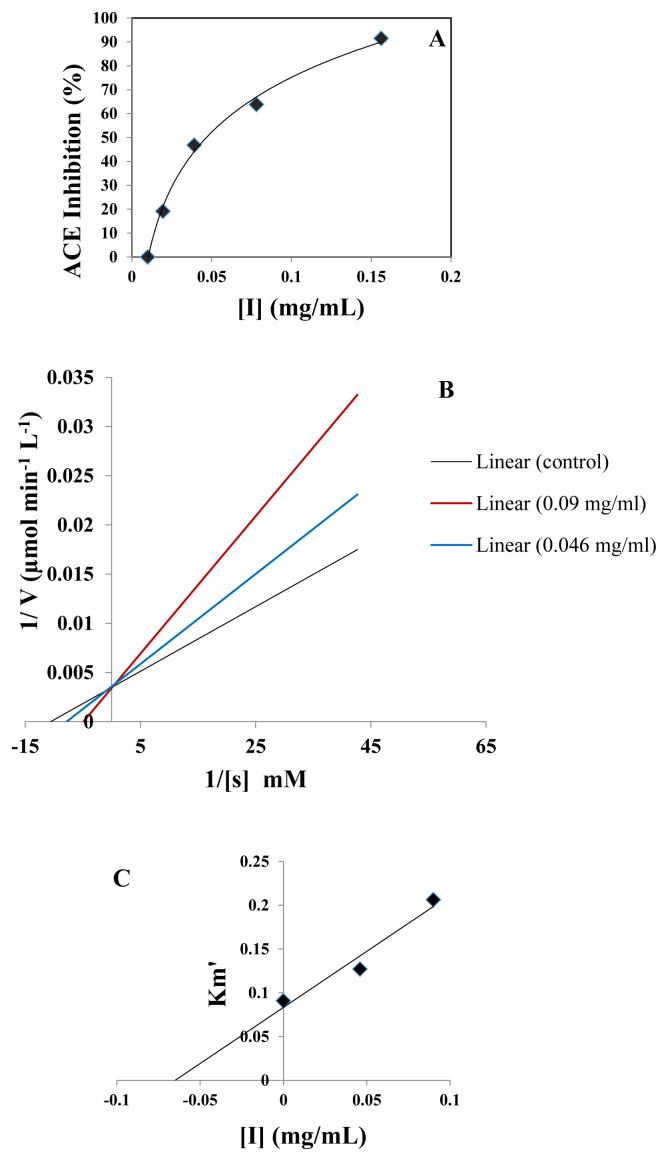
Figure 3.
(A) ACE inhibition curve at various concentrations of WG-9 peptide. (B) Lineweaver-Burk plots for ACE in the presence or absence of the peptide. The equations for the plot are as follows: y = 0.0003x + 0.0034 (R2 = 0.996) for control (without peptide); y = 0.0004x + 0.0035 (R2 = 0.999) at 46 μg/mL WG-9; and y = 0.00069x + 0.0034(R2 = 0.995) at 90 μg/mL WG-9. (C) The secondary plot for the WG-9 peptide is the competitive inhibitor. ACE = angiotensin-converting enzyme.

