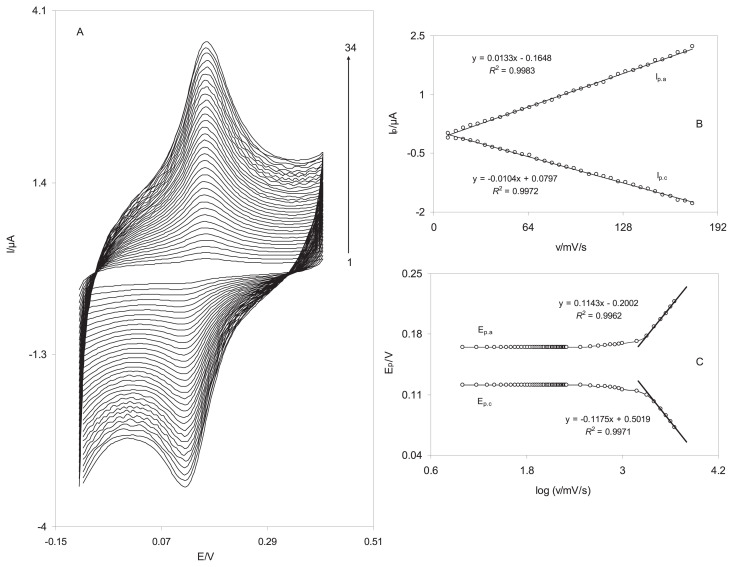
Figure 4.
Cyclic voltammograms of the DSNPs-GCE in 0.10M phosphate buffer solution (pH 7.0) at different scan rates. The numbers 1–34 correspond to 10–175 mV/s. (A) The plots of anodic and cathodic peak currents versus the scan rate. (B) The variation in the peak potentials versus the logarithm of the scan rate. DSNPs-GCE = delphinidin silver nanoparticles modified glassy carbon electrode.

