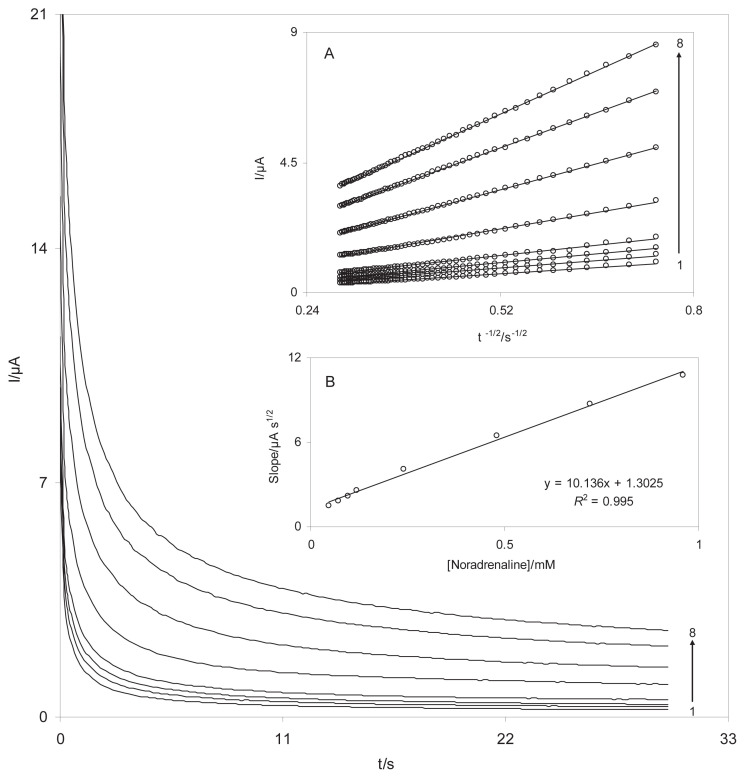
Figure 8.
Chronoamperometric responses of DSNPs-GCE in a 0.10 M phosphate buffer solution (pH 7.0) at a potential step 200 mV for different concentrations of NA. The numbers 1–8 correspond to 0.02–0.8mM NA. The insets show (A) the plots of I versus t−1/2 obtained from chronoamperograms, and (B) the plot of the slope of straight lines against the NA concentrations. DSNPs-GCE = delphinidin silver nanoparticles modified glassy carbon electrode; NA = noradrenaline.

