. 2022 Feb 1;20(5):735–748. doi: 10.1158/1541-7786.MCR-21-0729

Figure 2.

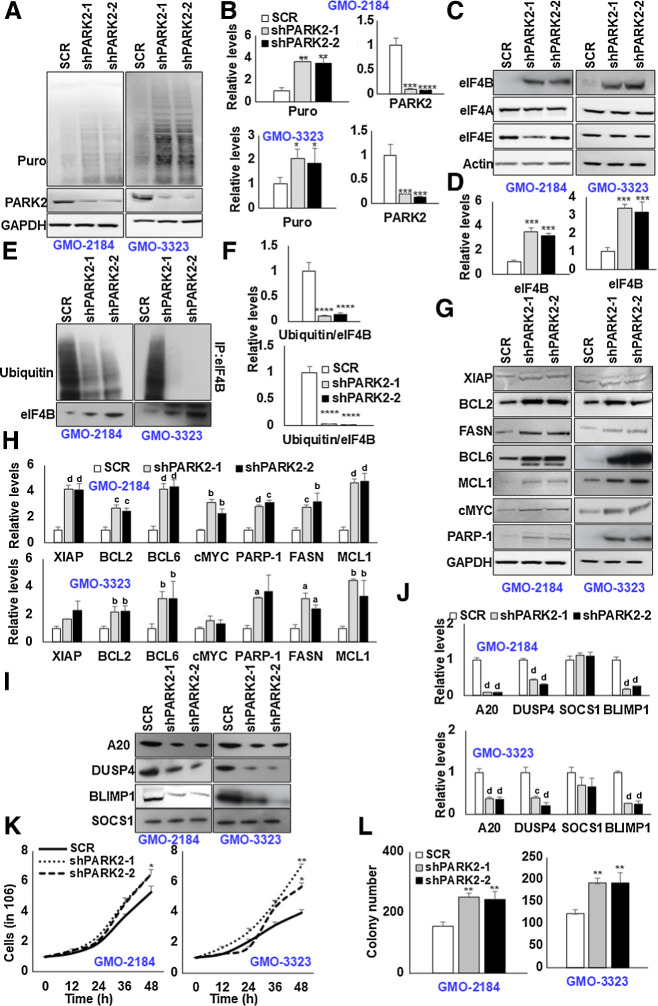
Figure 2. Depletion of PARK2 augments eIF4B signaling. A, PARK2-depleted stable GMO cells (2184, 3323) were cultured in the presence of puromycin (3 μg/mL) for 30 minutes, and lysates were probed for defined antibodies. GAPDH was used as the loading control. B, Densitometric quantification of the immunoblots in A. Values were normalized with their corresponding loading controls and neutralized with corresponding SCR-infected cells, which was set as 1; represented as mean ± SD for n = 3. Statistical analysis was performed using one-way ANOVA followed by Dunnett post hoc analysis. *, P < 0.05; **, P < 0.01; ***, P < 0.005 versus SCR-infected cells. C, G, and I, PARK2-depleted stable GMO cells (2184, 3323) were probed for defined antibodies. Actin was used as the loading control. D, H, and J, Densitometric quantification of the immunoblots in C, G, and I, respectively. Values were normalized with their corresponding loading controls and neutralized with corresponding SCR-infected cells, which was set as 1; represented as mean ± SD for n = 3. Statistical analysis was performed using one-way ANOVA followed by Dunnett post hoc analysis. a, P < 0.05; b, P < 0.01; c, P < 0.005; d, P < 0.001 versus SCR-infected cells. E, PARK2-depleted stable GM-B cells (2184, 3323) were treated with C75 (10 μmol/L) for 8 hours. Posttreatment, eIF4B was enriched from the cellular lysates, and ubiquitin levels were determined by immunoblotting. F, Densitometric quantification of the immunoblots in E. Values were normalized with corresponding eIF4B levels and neutralized with their corresponding SCR-infected cells, which was set as 1; represented as mean ± SD for n = 3. Statistical analysis was performed using one-way ANOVA followed by Dunnett post hoc analysis. ****, P < 0.001 versus SCR-infected cells. K, Indicated PARK2-depleted stable cells were seeded 1 million per well in 6-well plates. After 12 hours, the cells were collected and counted using trypan blue. Values are expressed as mean ± SD (n  =  3), *, P < 0.05; **, P < 0.01 versus SCR-infected corresponding cells. L, The total number of colonies grown in PARK2-depleted cells in methylcellulose culture. Colony counts were performed on the 15th day of methylcellulose culture. **, P < 0.01 versus corresponding SCR-infected control cells.

Depletion of PARK2 augments eIF4B signaling. A, PARK2-depleted stable GMO cells (2184, 3323) were cultured in the presence of puromycin (3 μg/mL) for 30 minutes, and lysates were probed for defined antibodies. GAPDH was used as the loading control. B, Densitometric quantification of the immunoblots in A. Values were normalized with their corresponding loading controls and neutralized with corresponding SCR-infected cells, which was set as 1; represented as mean ± SD for n = 3. Statistical analysis was performed using one-way ANOVA followed by Dunnett post hoc analysis. *, P < 0.05; **, P < 0.01; ***, P < 0.005 versus SCR-infected cells. C, G, and I, PARK2-depleted stable GMO cells (2184, 3323) were probed for defined antibodies. Actin was used as the loading control. D, H, and J, Densitometric quantification of the immunoblots in C, G, and I, respectively. Values were normalized with their corresponding loading controls and neutralized with corresponding SCR-infected cells, which was set as 1; represented as mean ± SD for n = 3. Statistical analysis was performed using one-way ANOVA followed by Dunnett post hoc analysis. a, P < 0.05; b, P < 0.01; c, P < 0.005; d, P < 0.001 versus SCR-infected cells. E, PARK2-depleted stable GM-B cells (2184, 3323) were treated with C75 (10 μmol/L) for 8 hours. Posttreatment, eIF4B was enriched from the cellular lysates, and ubiquitin levels were determined by immunoblotting. F, Densitometric quantification of the immunoblots in E. Values were normalized with corresponding eIF4B levels and neutralized with their corresponding SCR-infected cells, which was set as 1; represented as mean ± SD for n = 3. Statistical analysis was performed using one-way ANOVA followed by Dunnett post hoc analysis. ****, P < 0.001 versus SCR-infected cells. K, Indicated PARK2-depleted stable cells were seeded 1 million per well in 6-well plates. After 12 hours, the cells were collected and counted using trypan blue. Values are expressed as mean ± SD (n  =  3), *, P < 0.05; **, P < 0.01 versus SCR-infected corresponding cells. L, The total number of colonies grown in PARK2-depleted cells in methylcellulose culture. Colony counts were performed on the 15th day of methylcellulose culture. **, P < 0.01 versus corresponding SCR-infected control cells.