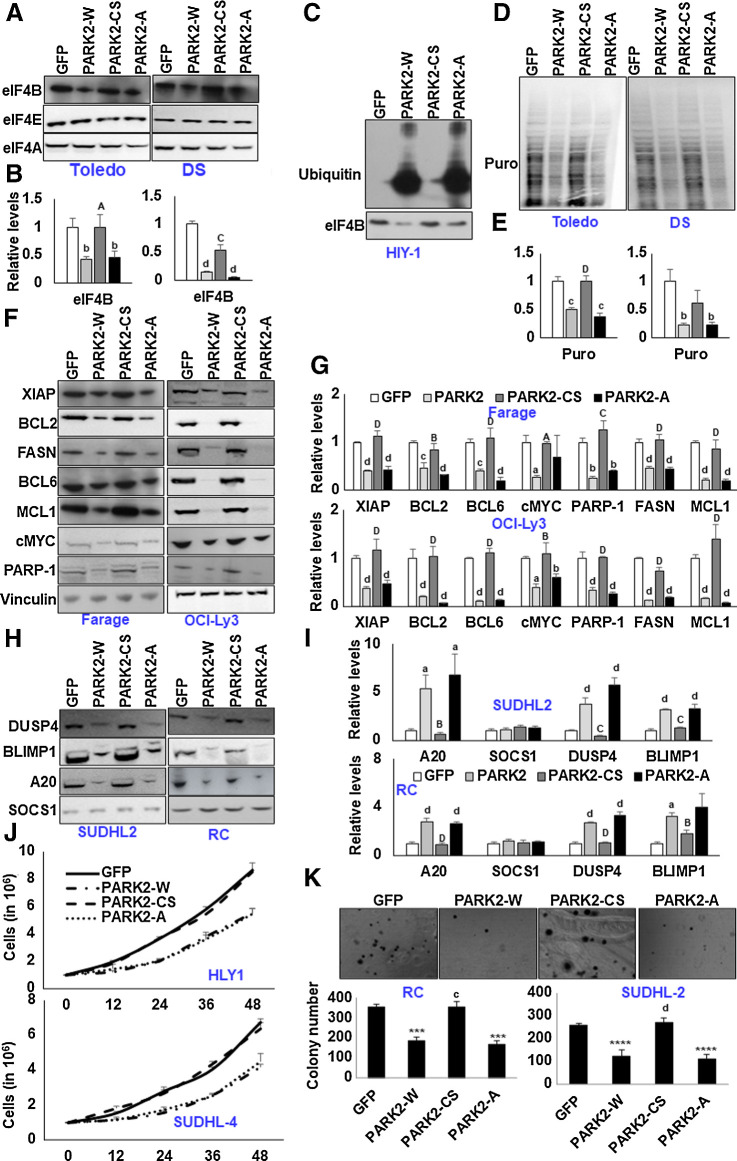
Figure 5.
mTOR-modified PARK2 fails to ubiquitinate eIF4B. A, Indicated cells were stably infected with the retroviral particles expressing GFP or PARK2 mutants and probed for the defined antibodies. B, Densitometric quantification of the immunoblots in A. Values were normalized with their corresponding loading controls and neutralized with GFP-expressing cells, which was set as 1; represented as mean ± SD for n = 3. Statistical analysis was performed using one-way ANOVA followed by Bonferroni post hoc analysis. b, P < 0.01; d, P < 0.001 versus GFP-infected cells. A, P < 0.05; C, P < 0.005 versus PARK2-W–infected cells. C, Transiently infected HLY1 cells were lysed, and eIF4B was immunoprecipitated, followed by the probing with ubiquitin. D, Indicated cells stably expressing the genes were challenged with puromycin. Posttreatment, cells were lysed, and the puromycin incorporation was studied using an anti-puromycin antibody. E, Densitometric quantification of the immunoblots in D. Values were normalized with their corresponding loading controls and neutralized with GFP expressing cells, which was set as 1; represented as mean ± SD for n = 3. Statistical analysis was performed using one-way ANOVA followed by Bonferroni post hoc analysis. b, P < 0.01; d, P< 0.001 versus GFP-infected cells. D, P < 0.001 versus PARK2-W–infected cells. F and H, Indicated cells were stably infected with the retroviral particles expressing GFP or PARK2 mutants and probed for the defined antibodies. G and I, Densitometric quantification of the immunoblots in F and H, respectively. Values were normalized with their corresponding loading controls and neutralized with GFP-expressing cells, which was set as 1; represented as mean ± SD for n = 3. Statistical analysis was performed using one-way ANOVA followed by Bonferronis post hoc analysis. a, P < 0.05; b, P < 0.01; c, P < 0.005; d, P < 0.001 versus GFP-infected cells. B, P < 0.01; C, P < 0.005; D, P < 0.001 versus PARK2-W–infected cells. J, Indicated PARK2 (wild type and mutants) stable cells were seeded 1 million per well in 6-well plates. GFP-infected were used as the internal control. After 12 hours, the cells were collected and counted using trypan blue. Values are expressed as mean ± SD (n = 3); *, P < 0.05 versus GFP-infected corresponding cells; a, P < 0.05 versus PARK2-W–infected corresponding cells. K, The total number of colonies grown in PARK2-expressing (wild type and mutants) cells in methylcellulose culture. Colony counts were performed on the 15th day of methylcellulose culture. ***, P < 0.005; ****, P < 0.001 versus corresponding GFP-infected control cells; c, P < 0.005; d, P < 0.001 versus corresponding PARK2-W–infected control cells.

