. 2022 Feb 1;20(5):735–748. doi: 10.1158/1541-7786.MCR-21-0729

Figure 6.

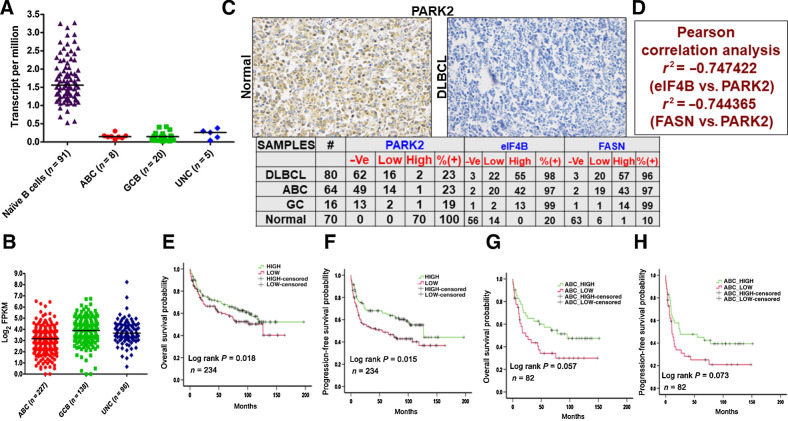
Figure 6. Clinicopathologic evaluation of PARK2. A, Representative plots show expression profiles of PARK2 in naïve B cells (obtained from DICE database https://dice-database.org/) compared with molecular subgroups of patients with DLBCL in TCGA dataset. PARK2 showed significantly lower expression in tumor samples compared with control. B, Comparison of PARK2 in molecular subgroups using a publicly available large dataset of patients with DLBCL (https://gdc.cancer.gov/about-data/publications/DLBCL-2018). PARK2 showed significantly lowest expression in ABC-DLBCL subgroups compared with GCB-DLBCL and UNC-DLBCL. C, Representative IHC image of commercially procured TMA slides stained with PARK2 antibody. Summary of the PARK2, eIF4B, and FASN stained slides for DLBCL and normal reactive lymph node samples. -Ve: no staining detected, low: 1–2 staining density, high: 3–4 staining density (D) Pearson correlation evaluation of the stained slides. E, PARK2 expression was found to be significantly (P 0.05) associated with OS of patients with DLBCL in the publicly available dataset. Patients with a higher median expression of PARK2 showed better prognosis than patients having lower than median expression. F, PARK2 expression was also found to be significantly (P 0.05) associated with the PFS in the same cohort of patients with DLBCL having a similar outcome. G, The same cohort was segregated into molecular subgroups, and higher median PARK2 expression in patients with ABC-DLBCL showed significantly (P 0.05) better prognosis than patients having lower than median expression. H, PFS analysis in patients with ABC-DLBCL showed a similar trend, albeit not statistically significant (P 0.05).

Clinicopathologic evaluation of PARK2. A, Representative plots show expression profiles of PARK2 in naïve B cells (obtained from DICE database https://dice-database.org/) compared with molecular subgroups of patients with DLBCL in TCGA dataset. PARK2 showed significantly lower expression in tumor samples compared with control. B, Comparison of PARK2 in molecular subgroups using a publicly available large dataset of patients with DLBCL (https://gdc.cancer.gov/about-data/publications/DLBCL-2018). PARK2 showed significantly lowest expression in ABC-DLBCL subgroups compared with GCB-DLBCL and UNC-DLBCL. C, Representative IHC image of commercially procured TMA slides stained with PARK2 antibody. Summary of the PARK2, eIF4B, and FASN stained slides for DLBCL and normal reactive lymph node samples. -Ve: no staining detected, low: 1–2 staining density, high: 3–4 staining density (D) Pearson correlation evaluation of the stained slides. E, PARK2 expression was found to be significantly (P 0.05) associated with OS of patients with DLBCL in the publicly available dataset. Patients with a higher median expression of PARK2 showed better prognosis than patients having lower than median expression. F, PARK2 expression was also found to be significantly (P 0.05) associated with the PFS in the same cohort of patients with DLBCL having a similar outcome. G, The same cohort was segregated into molecular subgroups, and higher median PARK2 expression in patients with ABC-DLBCL showed significantly (P 0.05) better prognosis than patients having lower than median expression. H, PFS analysis in patients with ABC-DLBCL showed a similar trend, albeit not statistically significant (P 0.05).