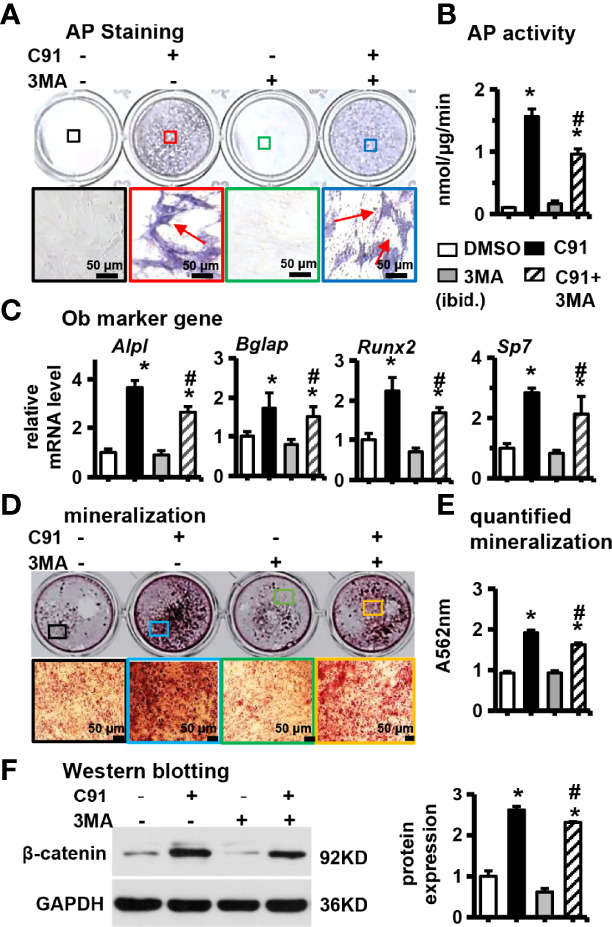
Figure 5.

Effects of inhibition of autophagy on ST2 cell differentiation. 3MA is an inhibitor of autophagy. Before ST2 cells were treated with C91, they were pre-treated with autophagy inhibitor 3MA (5 mM) for 6 hours. The samples were collected for AP staining (A) analysis and AP biochemical quantitative (B) analysis. The bottom panel is 10× magnification of the upper panel, red arrows are alkaline phosphatase-positive cells, scale bar = 50 μm. (C) qRT-PCR analysis results. (D) ST2 cells were pre-treated with autophagy inhibitor 3MA for 6 hours, and then ST2 cells were treated with C91 for 14 days, and the osteogenic induction medium was changed every two days. Alizarin red S staining was used to detect mineralized nodules. The lower image is a 10× enlargement of the upper image. Scale bar = 50 μm. (E) is the quantitative analysis result of panel (D, F) The expression of protein β-catenin was detected by Western blot, and the bar on the right is the quantitative result of the band on the left. Results are expressed as mean ± SD (n = 3 per group). *P<0.05, compared to the DMSO group. # P<0.05, compared to the C91 group.
