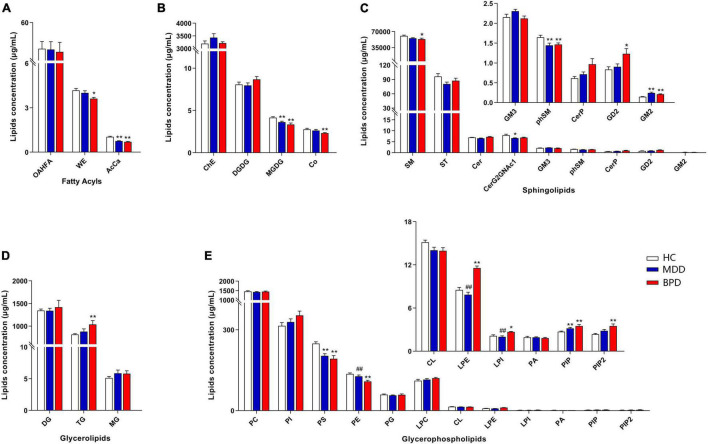
FIGURE 1.
Differential concentration of lipid class among major depressive disorder (MDD), bipolar depression (BPD), and healthy controls (HC). (A) Fatty acyls, (B) ChE, Co, DGDG, and MGDG, (C) sphingolipids, (D) glycerolipids, (E) glycerophospholipids. HC, healthy controls; MDD, major depressive disorder; BPD, bipolar depression; OAHFA, (O-acyl)-1-hydroxy fatty acid; WE, wax esters; AcCa, acylcarnitine; ChE, cholesterol ester; Co, coenzyme; DGDG, digalactosyldiacylglycerol; MGDG, monogalactosyldiacylglycerol; SM, sphingomyelin; ST, sulfatide; Cer, ceramides; CerP, ceramides phosphate; phSM, phytosphingomyelin; DG, diglyceride; TG, triglyceride; MG, monoglyceride; PC, phosphatidylcholine; PI, phosphatidylinositol; PS, phosphatidylserine; PE, phosphatidylethanolamine; PG, phosphatidylglycerol; CL, cardiolipin; LPC, lysophosphatidylcholine; LPE, lysophosphatidylethanolamine; LPI, lysophosphatidylinositol; PA, phosphatidic acid; PIP, phosphatidylinositol; PIP2, phosphatidylinositol 4,5-bisphosphate. *P < 0.05 vs. HC; **P < 0.01 vs. HC, ##P < 0.01 vs. BPD.

