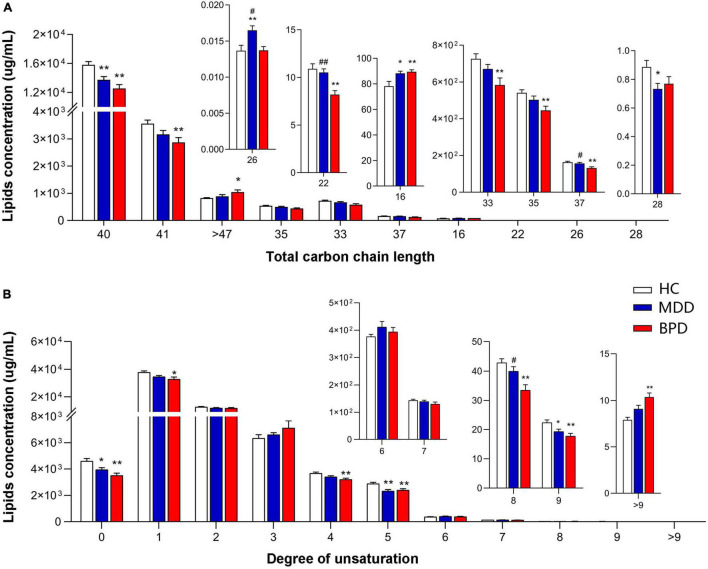
FIGURE 2.
Groupwise alterations in fatty acid composition in the plasma. Results of analysis of fatty acyl composition by (A) chain length (number of carbons) and (B) degree of unsaturation. Lipids showing low levels results have been enlarged in insets. HC, health control; MDD, major depressive disorder; BPD, bipolar depression; *P < 0.05 vs. HC; **P < 0.01 vs. HC; #P < 0.05 vs. BD; ##P < 0.01 vs. BPD.

