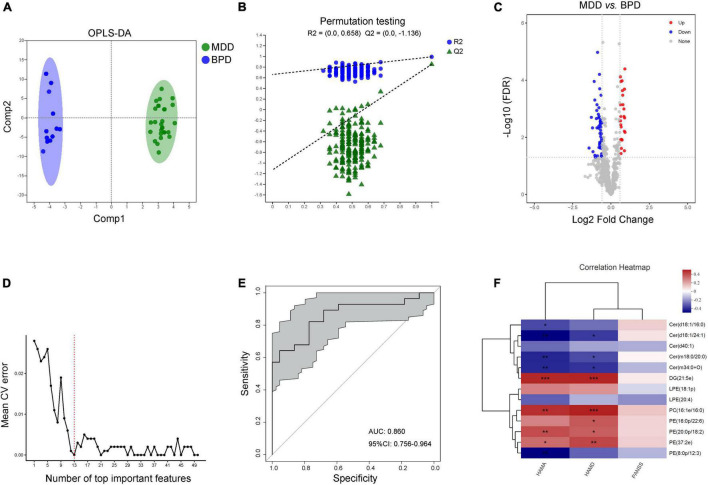
FIGURE 5.
Characteristic lipid species between MDD and BPD. (A) Scatter plot of OPLS-DA model and (B) validation model of permutation test, (C) volcano map reveals the increased (red dots) and decreased (blue dots) lipid species between the MDD and BPD, (D) random forest model and 10-fold cross-validation showed that the lipids with the top 13 importance had the lowest model error rate, (E) ROC analysis for the combinational lipids, (F) correlation between clinical parameters and levels of 13 lipid species. *P < 0.05; **P < 0.01, ***P < 0.001.

