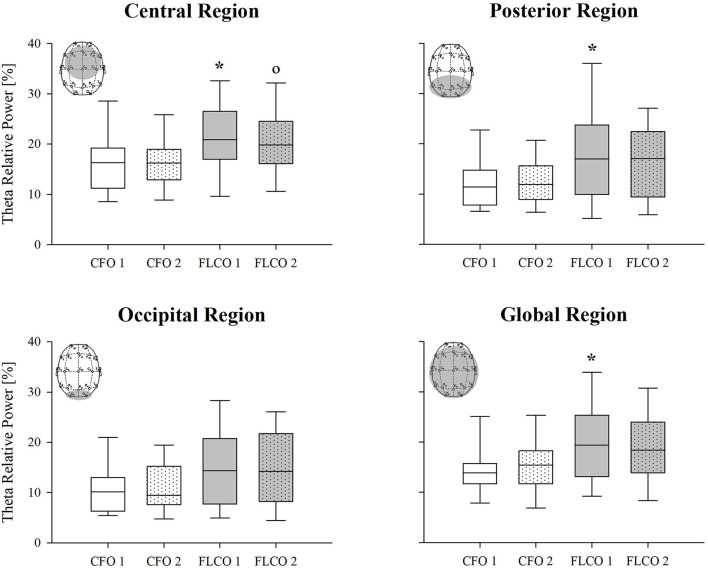
Figure 1.
A box-and-whisker plot representing the median (line within the box), the interquartile range (length of the box), the 90th and 10th percentiles (whiskers above and below the box) of the electroencephalographic derived theta relative power in central (top left panel), posterior (top right panel), occipital (bottom left panel), and global regions (bottom right panel) in operators who worked in COVID-19-free wards and departments (CFO, white) and in frontline COVID-19 operators during the pandemic (FLCO, gray) during the first (1) and the second sessions (2). *p < 0.05 CFO1 vs. FLCO1; °p < 0.05 CFO2 vs. FLCO2.

