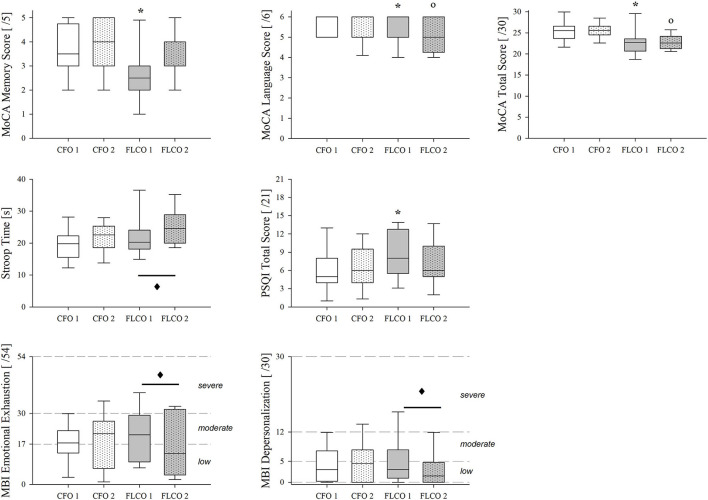
Figure 4.
A box-and-whisker plot representing the median (line within the box), the interquartile range (length of the box), the 90th and 10th percentiles (whiskers above and below the box) of cognitive tests, and surveys results: MoCA memory score (top left panel), MoCA language score (top central panel), MoCA total score (top right panel), Stroop Color and Word Test time duration (middle left panel), Pittsburgh Sleep Quality Index Total Score (middle central panel), MBI-GS Emotional Exhaustion (bottom left panel), and depersonalization (bottom central panel) in operators who worked in COVID-19-free wards and departments (CFO, white) and in frontline COVID-19 operators during the pandemic (FLCO, gray) during the first (1) and the second sessions (2). *p < 0.05 CFO1 vs. FLCO1; °p < 0.05 CFO2 vs. FLCO2; ♦: p < 0.05 FLCO1 vs. FLCO2.

