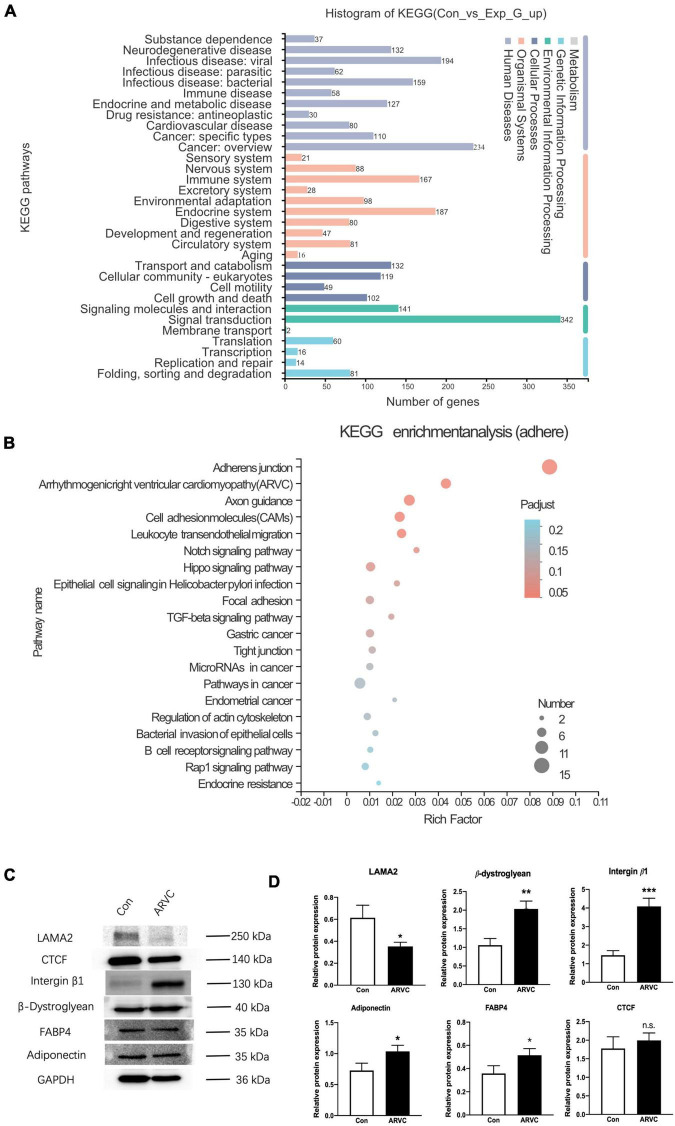
FIGURE 5.
The analysis of iPSC-derived CMs indicated an ARVC-associated phenotype. (A) Histogram of KEGG signaling pathway classification. (B) KEGG enrichment analysis of the adherent signaling pathway. (C) Western blot results showed the protein expressions of LAMA2, CTCF, Integrin-β1, β-Dystroglycan, FABP4, and Adiponectin in myocardium cells of the control group and the ARVC group, with GAPDH as internal reference. (D) Histogram shows the protein expression differences of LAMA2, CTCF, Integrin-β1, β-Dystroglycan, FABP4, and Adiponectin between the control group and the ARVC group (N.S. The difference is meaningless; *p < 0.05; **p < 0.01; ***p < 0.001).

