Figure 1.
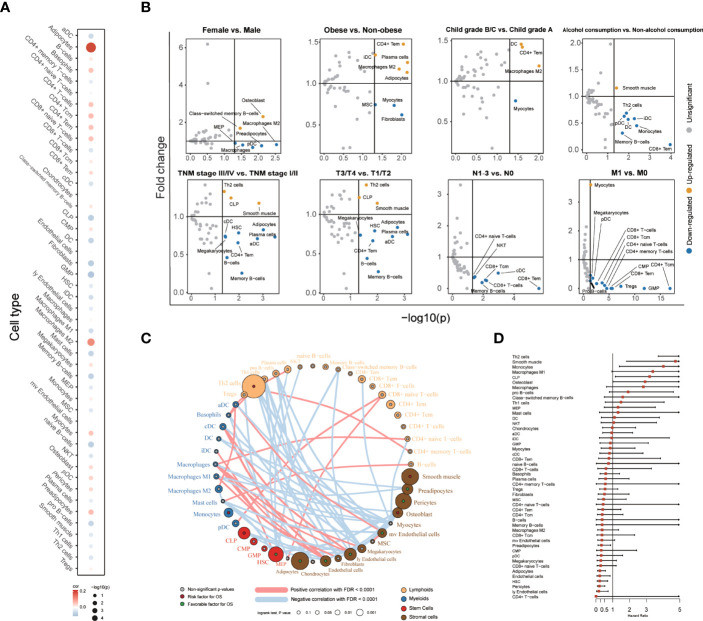
The association between 48 cells in TME and clinical characteristics with patients. (A) Correlation between age and cell score. The size of each cell represented the correlation between age and cell score. Spearman correlation coefficients and the associated p-value (Spearman) were shown. (B) Volcano plot diagrams showed the comparison of cell infiltration levels. The significance (p-value) versus and fold change were plotted on the X-axis and T-axis. (C) Landscape of the TME in LIHC. Cellular interaction of the TME cell types. The lymphoid cells are marked by yellow; the myeloid cells are marked by blue; stem cells are marked by red; and stromal cells are marked by brown. The size of each cell represents the survival impact of each TME cell type, which was calculated by log10 (log-rank test p values indicated). Risk factors are indicated in red, and favorable factors for overall survival are indicated in green. The lines connecting TME cells represent cellular interactions. The thickness of the line represents the strength of correlation estimated by Spearman correlation analysis. Positive correlation is indicated in red and negative correlation in blue. (D) Forest plots showing multivariable Cox regression analyses of the cell score, and each score is adjusted by age and TNM stage.

