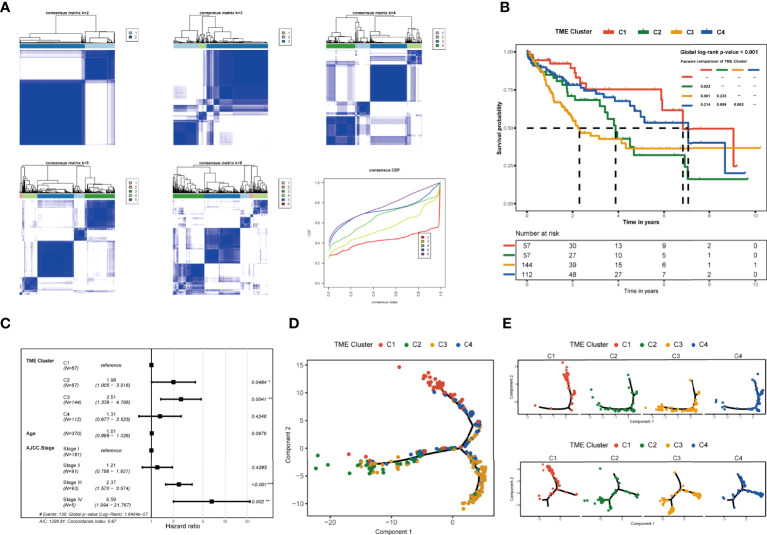
Figure 2.
Identification and clinical characteristics of TME subgroups. (A) Consensus clustering displaying the robustness of sample classification using multiple iterations (×1,000) of k-means clustering. The consensus distribution function (CDF) depicting the cumulative distribution from consensus matrices at a given cluster number (k). (B) Kaplan–Meier curves for overall survival of 370 patients in TCGA database showed the association between TME subtypes and overall survival (global log-rank test, p = 0.00033). (C) Forest plots showing multivariate Cox regression analyses of the TME class, age, and TNM stage on the overall survival of LIHC patients. (D) Pseudotime trajectory analysis speculated the developmental relationship of the clusters based on the differential genes. (E) Pseudotime trajectory analysis of 370 patients in TCGA based on the glycan biosynthesis and metabolism pathway-related genes and cellular processes (including transport and catabolism, cell growth and death, cellular community, and cell motility) pathway-related genes. *p≤ 0.05, **p≤ 0.01, ***p≤ 0.001.

